


Intro to forex divergence
In the currencies market, we know that trends don’t move in the same direction forever. Identifying trends is one thing, but it’s equally essential to spot potential trend changes. A simple and classic technique for doing this is forex divergence.
This article will uncover all the different types of divergence in forex trading, how to spot them and avoid some common mistakes. We will even go a step further and show you a unique divergence forex strategy.
Key Findings
- A mismatch between price and oscillator or correlated asset warns of impending reversal or continuation.
- Three divergence types: Regular signals reversal, Hidden signals continuation, SMT compares correlated pairs to detect smart-money activity.
- SMT divergence offers a leading indicator; correlation failure between DXY and EUR/USD often precedes institution-driven, “explosive” directional moves.
- High-probability trades emerge when divergence aligns with key bank levels, higher-timeframe trend, news catalysts, and 50-79% Fibonacci pullback confirmation.
- Oscillator choices: RSI delivers clear overbought/oversold divergence, MACD yields rarer but firmer signals, Stochastics are best for choppy ranges.
What Is Forex Divergence?
The Cambridge Dictionary defines divergence as a ‘situation in which two things become different.’ Well, the divergence in forex has a similar meaning.
In simple terms, forex divergence refers to a mismatch between price movements and a technical tool (usually an oscillator or momentum indicator). We will also cover another type of forex divergence later, using correlated assets in FX.
Divergence in forex aims to warn traders of a potential reversal in the price, which may be temporary or long-lasting, depending on the timeframe. However, this technique can also suggest a trend continuation on the higher timeframes while it’s a reversal on the lower timeframes.
Let us continue by exploring the different types of divergence in forex.
Types of Divergence in Forex
All forex divergence initially consists of an inverse relationship between the high-low structure of the price of two or more trading assets or between the price and the indicator of one trading asset.
In General, we have three types of divergence in forex.
1. Regular Indicator Forex Divergence
As the term suggests, this is the most basic type of divergence that usually happens at the end of a long-term trend relative to the timeframe it occurs. A regular forex divergence is typically a warning sign that the trend might be reversing soon.
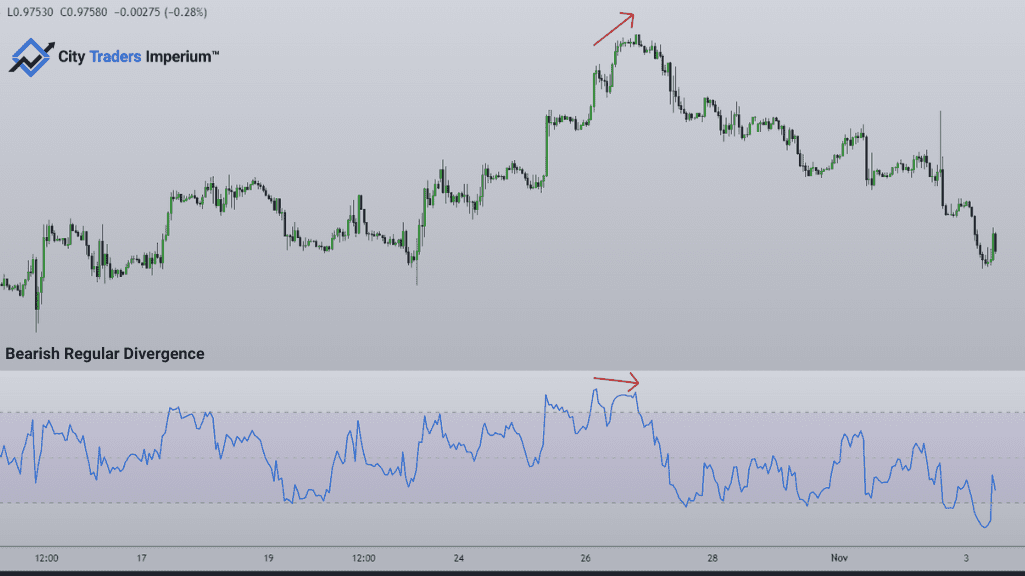
Bearish Regular Divergence
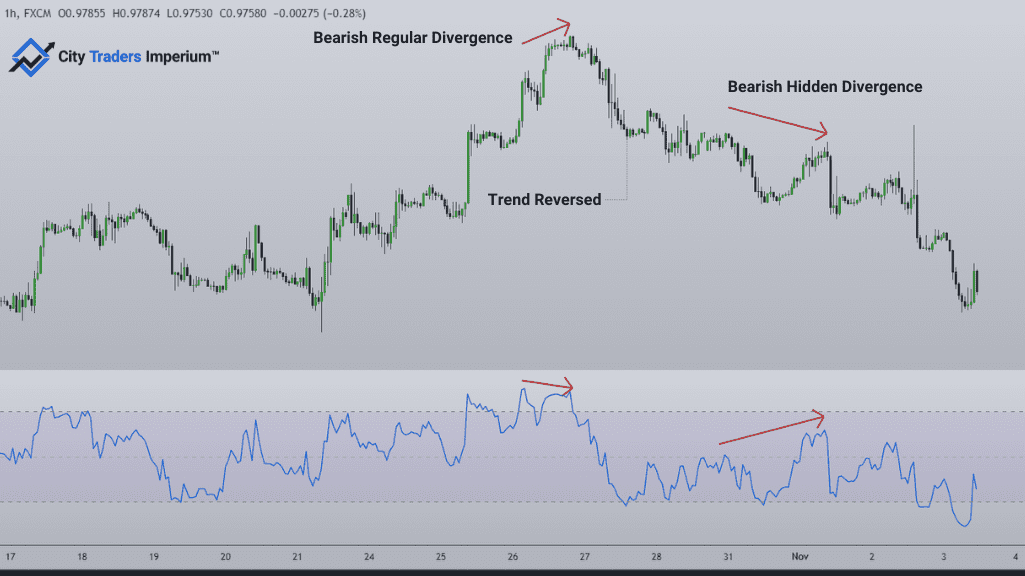
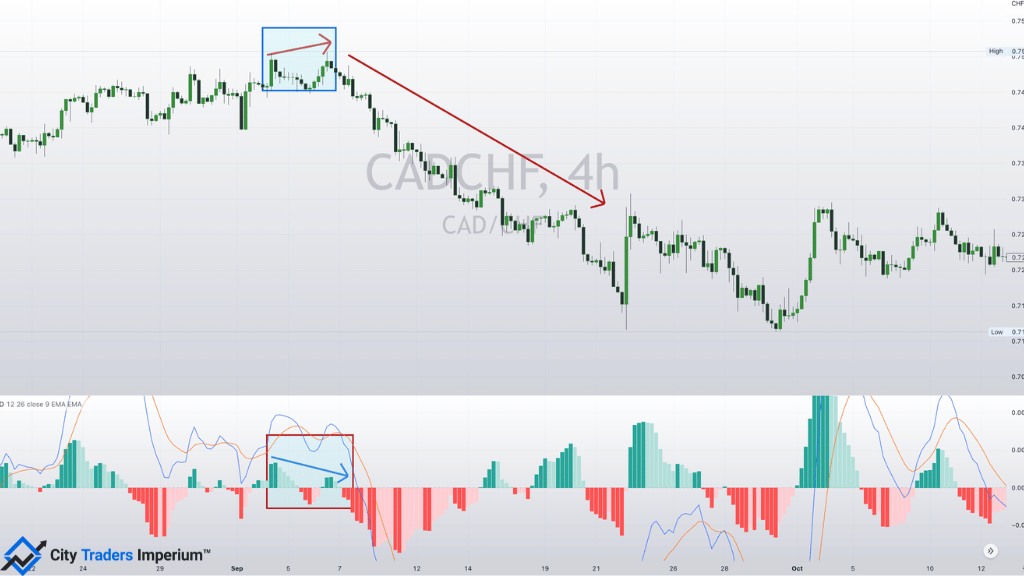
This Forex Divergence occurs in an uptrend. The price makes two consecutive higher highs, while the indicator makes a higher high followed by a lower high. This suggests the price might reverse soon to begin a downtrend or a retracement depending on the current market conditions and higher timeframe market structure.
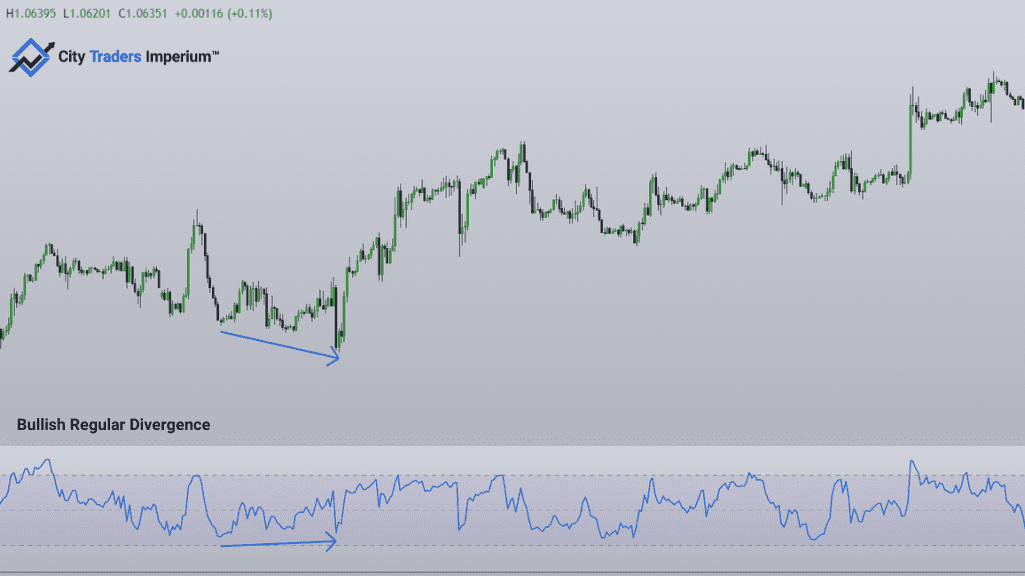
Bullish Regular Divergence
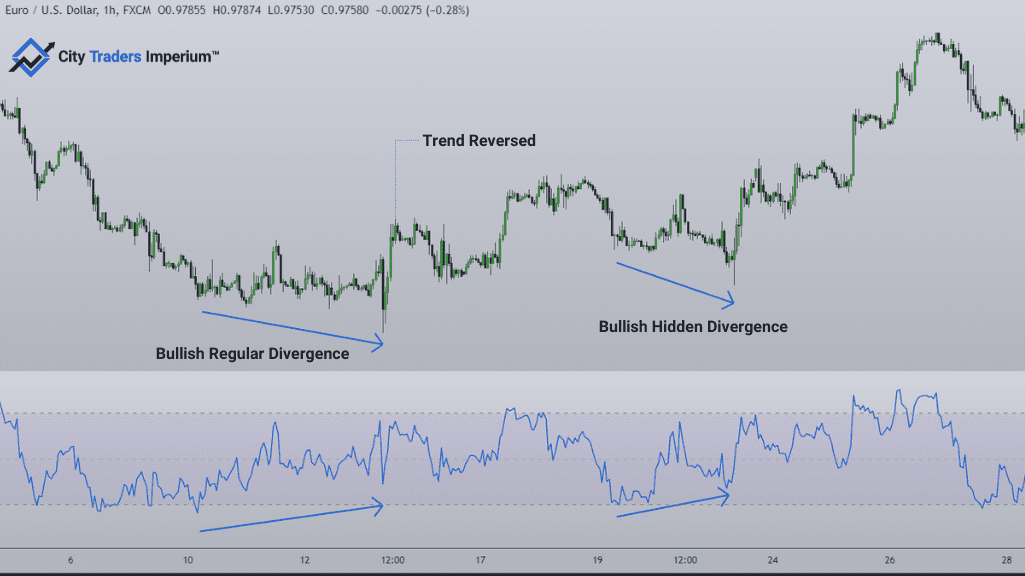
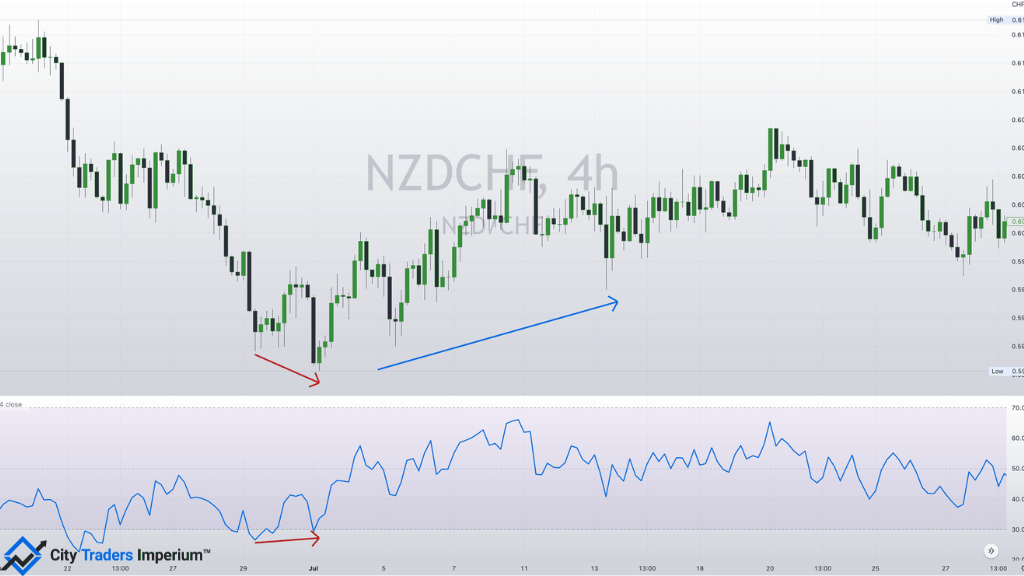
This divergence happens in a downtrend. The price makes two consecutive lower lows while the indicator makes a lower low followed by a higher low. This also implies the price might reverse soon to begin an uptrend or a retracement depending on the current market conditions and higher timeframe market structure.
2. Hidden Indicator Forex Divergence
Hidden forex divergence typically happens at the end of a corrective phase of the existing trend or just after a trend has reversed. It suggests that the market will continue moving in the predominant direction in a particular timeframe.
Of course, there is bullish and bearish forex divergence. It’s worth noting that hidden forex divergence is a much higher probability signal because if you were to take a trade, you would be trading within the same direction of the current trend.
Bearish Hidden Divergence
This divergence occurs when the market is already in a downtrend. The price makes two consecutive higher highs, while the indicator makes a higher high followed by a lower high. This usually signals the correction phase is about to end, and the price will probably soon continue trending lower.
Bullish Hidden Divergence
This forex divergence occurs when the market is already in an uptrend. The price makes two consecutive lower lows, while the indicator makes a lower low followed by a higher low. This typically suggests the correction phase is about to end, and the price will probably soon continue trending higher.
3. SMT Forex Divergence – The New Way for Looking at Divergence
This type of forex divergence is the most important one. It looks at two or three correlated trading assets to identify institutional accumulation or distribution.
It is known as SMT (Smart Money Technique) Divergence or divergence in price. You can think of this as a signal from institutions that they are stepping in, and the price will see an explosive move soon.
Divergence in price or SMT Divergence doesn’t rely on conventional lagging indicators. Instead, traders study a correlated asset and look for mismatches there. A typical instrument here is the dollar index (USDX), which is used to replace the indicator.
USDX (or ‘Dixie’) is an index tracking the dollar’s value relative to the currencies of six of its prominent trading partners: EUR, CHF, JPY, CAD, GBP, NZD, & AUD.
When the index is up, any pairs where USD is the quote currency (e.g., EUR/USD) tend to go down – inversely correlated.
Conversely, if USDX is bearish, markets where USD is the base currency (e.g., USD/CAD) often move upwards – positively correlated.
Studying these direct relationships while incorporating this type of forex divergence is highly advantageous in forecasting movements. It can be used to identify potential reversals in trends or trend continuations after retracements.
The dollar index is just one example of a correlated asset. You can find interesting correlations in other indexes as well. For instance, you can study the correlation among the three major indexes: S&P500, NASDAQ, and Dow Jones.
However, for the sake of this study, we will stick to what is widely popular and easy to understand, which is looking at the correlation of DXY vs EURUSD.
With SMT forex divergence, you simply match the highs and lows of a particular pair (e.g. EURUSD) against an index (e.g. DXY) or other instruments.
Generally, in normal market conditions, when DXY makes a higher high, EURUSD would make a lower low.
However, when these assets do not respect their inherent correlation, we can assume ‘smart money manipulation.’
When looking at bullish or bearish SMT forex divergence, it will depend on which trading asset we are looking at. For example, if we look at DXY vs EURUSD, as they are negatively correlated assets, a bullish divergence occurs on DXY or a bearish divergence on EURUSD.
So, let’s dive into what makes a bullish or bearish SMT forex divergence on DXY vs EURUSD.
Bearish SMT Forex Divergence
Here, DXY is trending down, while EURUSD is trending up. At some point, either DXY will fail to make a lower low, or EURUSD will fail to make a higher high, forming an SMT divergence.
So, one of the two scenarios might occur:
- DXY makes two consecutive lower lows, while EURUSD makes a higher high followed by a lower high, or;
- EURUSD makes two consecutive higher highs, while DXY makes a lower low followed by a higher low.
Again, we are only trading EURUSD, which signals that distribution is in place, and the SMT divergence is a sign that institutions have stepped in and we’re about to see explosive price moves.

Example of a Bullish Forex Divergence on EURUSD – Scenario #2

Bullish SMT Forex Divergence
Here, DXY is trending up, while EURUSD is trending down. At some point, either DXY will fail to make a higher high or EURUSD will fail to make a lower low, forming an SMT divergence.
So, one of the two scenarios might occur:
- DXY makes two consecutive higher highs, while EURUSD makes a lower low followed by a higher low, or;
- EURUSD makes two consecutive lower lows, while DXY makes a higher high, followed by a lower high.
So, given that we are trading EURUSD, this signals an accumulation is in place, and it is time to hunt for a long trade entry.

Example of a Bullish Forex Divergence on EURUSD – Scenario #2

How to Trade Divergence in Forex
- Monitor or trace the high and the low structure between the price and the indicator at around key price levels and medium and high impact forex calendar events.
- Once you see a divergence between the price and the indicator, start hunting for a trade setup.
- Also, you should align each high and/or low to confirm there is a divergence.
- Wait for the price to confirm there is a forex divergence until you see a reaction in price to form a short-term price swing.
- Wait for the price to pull back to 50%, 62%, or 79% Fibonacci levels, then place a trade with a stop loss below the right low for bullish divergence and above the right high for bearish divergence.
- There is no set profit target for this pattern. However, you should aim for at least twice the distance of your stop loss for a healthy risk-to-reward ratio (1:2).
The Best Forex Divergence to Use in Trading
Most forex divergence strategy formations are indicator-based. There is one problem with this approach. All indicators are naturally lagging, providing a signal after the move and not while it is happening. An indicator confirms what already transpired, at which point it may be too late for an optimal entry.
On the other hand, SMT divergence uses correlated assets as a leading tool. It offers a divergence before any technical indicator would. Still, many traders underestimate the power of analysing correlated markets to understand the next move on the pair they are trading. DON’T MAKE THE SAME MISTAKE.
Also, by understanding what the price is doing, you are actually looking at what institutions are trying to do by understanding accumulation and distribution in price at key price levels where institutions are most likely to step in and cause large price movements.
Using SMT divergence is a solid technique for seeking such opportunities.
How to Use Forex Divergence to Find Explosive Moves
It’s important to note the conditions in which we can trade these types of divergences where we have high probability conditions to enter a trade. If you want to be a profitable trader, you need to refine your entries to only enter when the conditions are in your favour with the highest probability possible.
So here are a few points worth mentioning if you add divergence as part of your trading tools.
Consider Key Price Levels
When looking at any pattern, the overarching blunder committed by many is trading on it alone. Charting with any formation is about confluence and context. A forex divergence signal that appears randomly doesn’t mean much. But when they occur at key price levels, trades are more likely to be profitable.
Divergence at around Medium or High-Impact Events
To increase the probability of divergence, it should be looked at around medium or high-impact forex news events because usually, the price tends to either reverse when such news comes out or get out of consolidation and continue an existing trend.
Using Forex Divergence is Not Everything
As with any technical analysis, divergence isn’t the be-all and end-all. Traders should combine it with other confirmation factors to form a solid trading idea. Traders should treat this pattern as a secondary element, not the primary reason for entering the markets.
Avoid Predicting Trend Reversals
Avoid predicting a reversal of a trend, as these tend to be a very low probability, as no one can know when a trend will end. This means do not use divergence as a tool to counter-trends. Instead, use it to help you time your entries in the same direction of an existing trend in line with the higher timeframe direction.
Know When to Use Each Type of Forex Divergence
First and foremost, when using divergence, it’s important to understand whether the market is most likely to reverse or retrace. Then, as mentioned above, do not try to predict market reversals. Using divergence is most beneficial when getting in sync with the existing trend.
Then, you can also use SMT or regular divergence to offer a signal to exit a trade before the price reverses or goes into a retracement. This will allow you to enter only high-probability setups.
Consulate Higher Timeframe Trend
It’s always best to use forex divergence in line with the existing trend of the higher timeframe. This will allow you to enter trades with explosive moves with high reward to risk and minimal drawdown.
If you try to trade a forex divergence against the higher timeframe trend, then even when divergence is present, it is usually short-lived and only signals a choppy correction or a retracement. Remember: our goal is to find explosive moves.
Choose Only High-Probability Divergence Scenarios
Be selective on which style of forex divergence to choose. As shown above, each forex divergence type has at least two scenarios.
So, it’s best to choose only the one that has a high probability, and that is where:
- When Bullish = the price of the asset that we are trading makes two consecutive lower lows, and the indicator or the price of the other asset fails.
- When Bearish = the price of the asset we are trading makes two consecutive higher highs, and the indicator or the price of the other asset fails.
This is because when the price of the asset (EURUSD) makes a lower low, the other asset (DXY) fails to make a higher high. This indicates that there was a run on liquidity on EURUSD or stop hunt, and the price isn’t likely to go below that low again. So you can safely place your stop loss below the second low on EURUSD.
The Best Indicators for Forex Divergence
In learning how to identify divergence in forex, you need to choose the best indicator. Let’s observe the top available options.
Relative Strength Index, “RSI”
Most chartists consider the Relative Strength Index (RSI) the most excellent choice for spotting divergence in forex. It’s a cleaner-looking oscillator compared to the MACD and stochastics and is best used in trending conditions.
Like any oscillator, traders use the RSI for overbought (reading above 70) and oversold (reading below 30) conditions. This is where you should hunt for forex divergence signals because it always begins at either of these points.
MACD
The MACD (moving average convergence divergence) is regarded as the most versatile momentum indicator, as traders use it to confirm trends and momentum.
MACD isn’t technically an oscillator but generates divergences using histograms. Yet, it tends to show less of these set-ups than other tools. However, this is also a benefit because the signals are more reliable due to the rarity.
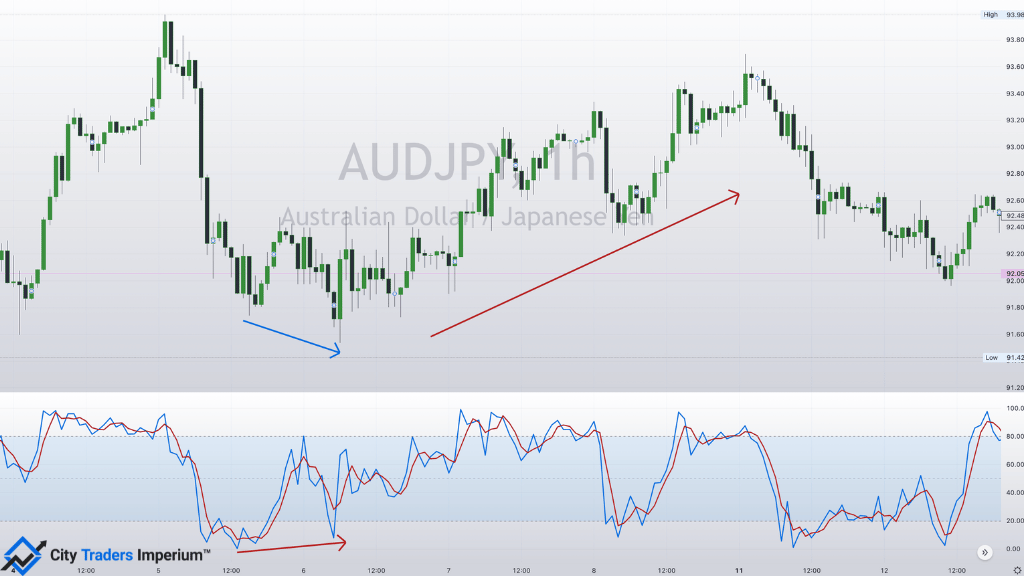
Stochastics
Stochastics are best for trading divergence in forex when there is a ‘choppy’ or ranging market. This is because the oscillator is more reactive to price changes, unlike the RSI. So, you can look for this pattern in these scenarios.
Final Word on Using Divergence in Forex Trading
So, there you have it – a solid guide exploring the divergence meaning in forex. Only some traders actively look for divergence signals. Still, it can be something worth observing as a confirmation signal in an existing trading system.
If you decide to implement forex divergence, diving further into the smart money concepts and correlated assets can be an edge-defining approach.