

How to Use Fibonacci Retracement
For traders in any financial market, Fibonacci retracement levels are indispensable for technical analysis and planning potential trade entries and exits.
Though the concept behind it is rooted in 13th-century mathematics, understanding Fibonacci retracements doesn’t have to be complicated. In fact, integrating the Fibonacci methodology into your trading approach is pretty straightforward. It’s actually a simple and advantageous way to plan your entries and exits.
In essence, Fibonacci retracement is a method of determining likely support and resistance levels that could occur as prices pull back within an overall trend. It is based on something known as “Fibonacci ratios,” – and there is logic behind why these specific levels tend to see trading activity.
This article will explain everything you need to know. We’ll cover what Fibonacci retracement is, how traders use it, and why it tends to work well. It is among the most widely followed indicators across all major trading platforms and financial instruments.
You’ll gain a highly useful tactic once you grasp the logic fueling Fibonacci analysis, one that can transform your trade outcomes over the long run. This guide breaks down the fundamentals every trader should know.
The Fibonacci Sequence
First things first, let’s get to the source – where do these Fibonacci retracement levels actually come from?
The answer lies in a mathematical sequence discovered by a 13th-century Italian mathematician, Leonardo Fibonacci. The sequence starts with 0 and 1, and each subsequent number is the sum of the previous two.
0, 1, 1, 2, 3, 5, 8, 13, 21, 34…and on to infinity. This simple string of numbers is the basis for the Fibonacci ratios, so beloved by technical traders.
But the sequence itself is less important for trading purposes than its derived ratios…
Fibonacci Ratios
While the Fibonacci sequence itself is fascinating, for trading purposes, it’s the derived ratios that matter to us. These ratios are obtained by dividing numbers in the sequence by other numbers at different positions. The most notable Fibonacci ratios used in trading are 23.6%, 38.2%, 61.8%, and 50% (though not a Fibonacci number, it’s often included due to its psychological significance).
61.8% (The Golden Ratio) – This is the most famous Fibonacci ratio. As an aside, the golden ratio appears frequently throughout nature – in flower petals, shells, animal bodies, and even in the spiral of galaxies.
It is obtained by dividing a number in the Fibonacci sequence by the number immediately following it. For example, 21 divided by 34 equals approximately 0.618, and if converted into a percentage, it becomes 61.8%.
38.2% -This ratio is found by dividing a number in the sequence by the number two places to its right. e.g., 34/89 ≈ 0.382 or 38.2%.
23.6% – This is a deeper retracement level. Divide one of the Fibonacci numbers by one three places to the right, for example, 21 divided by 89 or 23.6%.
Fibonacci Retracement Levels
Now we’ve got to grips with Fibonacci ratios, we finally get to discuss how we can apply these retracement levels when it comes to trading.
Fibonacci retracement levels are horizontal support and resistance lines corresponding to the Fibonacci ratios. After a noticeable price movement, retracements will often pull back to one of these levels before resuming the original trend.
The idea is markets exhibit herd mentality – when prices approach known Fibonacci levels, enough traders expect reversals that a self-fulfilling prophecy occurs. Whether the cause is psychological or analytical (or a bit of both), the price often respects these ratios.
Let’s give a couple of Forex trading pair examples:
Uptrend
The EUR/USD pair moves from 1.1000 to 1.2000, a marked uptrend. After this rise, the price starts to pull back. You’d draw Fibonacci retracement levels from 1.1000 (low) to 1.2000 (high).
If the price retraces to the 61.8% level and then starts to bounce back up, this level is acting as a strong support. This could be a good entry point for a long position if we anticipate the resumption of the uptrend.
Downtrend
Let’s say the USD/JPY pair falls from 110.00 to 100.00, indicating a clear downtrend. Fibonacci levels are drawn from 110.00 (high) to 100.00 (low).
Should the price climb up to the 38.2% level and then begin to fall again, this level could be seen as a clear resistance zone. This offers an opportunity to enter a short position, with a downtrend expected to continue.
Charting Fibonacci Retracements
Most analysis platforms contain a Fibonacci retracement tool. Traders simply identify the most recent swing points and connect them on the chart – levels populate automatically.
Fibonacci tools may look slightly different from one charting platform to the next, but they basically all function in the same way. You should also check if the tool’s preset levels include all the ratios you’re interested in. It might require a little tweaking or customization if they aren’t.
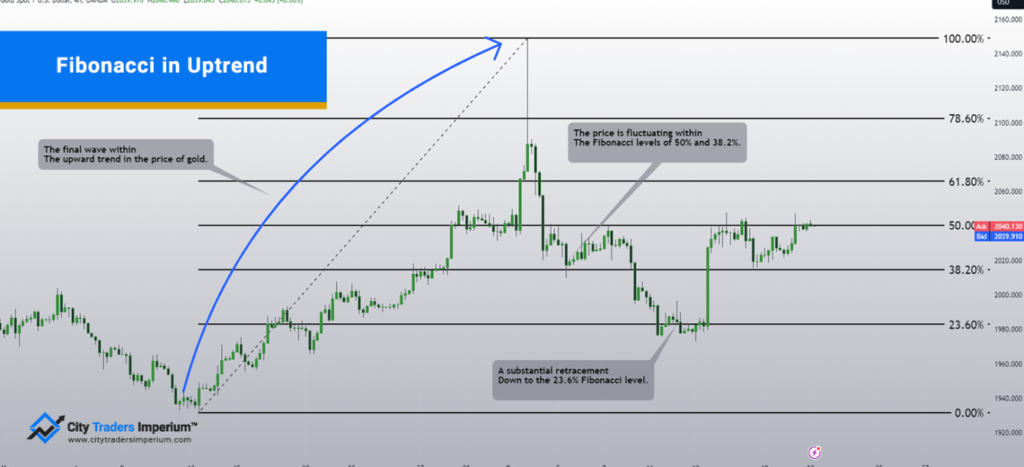
The first step is to confirm the overarching trend and determine if the market is in an overall uptrend or downtrend. This will dictate the swing points you connect.
In an Uptrend
Select the Fibonacci retracement tool on your platform. Click at the bottom (swing low) of the recent price movement and drag the tool to the top (swing high). The tool will automatically display the Fibonacci retracement lines and support levels (23.6%, 38.2%, 50%, 61.8%).
In a Downtrend
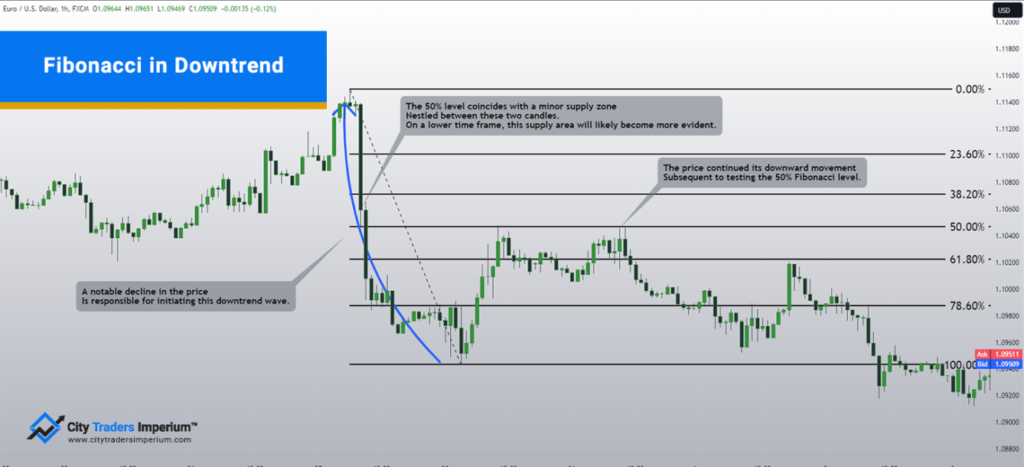
Choose the Fibonacci retracement tool. Click at the top (swing high) and drag the cursor down to the bottom (swing low). The tool will plot the Fibonacci levels, which in this case, act as potential resistance levels.
Combining Retracement Levels with Other Trading Strategies
Fibonacci retracement levels are useful on their own but can be made even better when combined with other trading tools. Here are some easy ways to use them.
Fibonacci and Moving Averages – Look for Fib levels that line up with popular moving averages like the 50-day or 200-day. If a price zone is confirmed by both, it’s a double-verified support or resistance area.
Fibonacci and Candlestick Patterns – Certain candlestick patterns (like doji, hammer, or engulfing patterns) that form at or near Fibonacci levels are worth exploring. A reversal candlestick pattern at a Fibonacci level can provide additional confirmation for entry or exit points.
Fibonacci and Oscillators – Oscillators like RSI or Stochastic help identify overbought/oversold conditions. If the RSI shows oversold conditions and the price retraces to a key Fibonacci level, it strengthens the probability of a reversal playing out.
Downsides of Fibonacci Retracements
While Fibonacci ratios are highly valued by many traders, they aren’t foolproof indicators. Overreliance on Fibonacci levels can backfire.
Not set in stone – There are no guarantees prices will reverse at Fib zones. Markets can always defy probabilities.
Potential false signals – With so many Fibonacci ratios clustered within range of each other, false signals are inevitable. For example, early pullback selling after 38.2% is reached may be premature if more downside ends up unfolding towards 61.8%.
Requires additional context – While useful guideposts, Fibonacci ratios shouldn’t be trusted blindly in isolation. As we’ve already mentioned, additional indicators like momentum oscillators can add context to the strength or weakness behind reversals.
In Conclusion
Mastering Fibonacci retracements gives traders a real edge in trending markets. By projecting probable reversal zones even before the price reaches them, Fibonacci retracement brings a level of foresight so traders can strategize their entries and exits with greater confidence.
Yet consistent trading success requires more than Fibonacci mastery alone. Staying profitable long-term means investing time in understanding and practicing complementary strategies to round out your skillset.
Once you’ve honed those skills and mindset to trade at an elite level, firms like City Traders Imperium open up a world of opportunity. As a leading prop trading firm, we can provide the capital, education, and backing to unlock your full potential. So, for traders ready to step up and seize the day, it’s time to get funded today!