


Share this article with others
In this article, we will look into one of the titans of technical analysis. The principle of Forex Supply and Demand, and how we can use this established principle to improve your trading results by increasing both the probability of trades as well as their profitability.
Supply and Demand in Forex Training Key Highlights
- Discover how supply and demand zones drive currency prices.
- Learn to spot and interpret supply and demand zones for better trades.
- Apply strategies for high-probability trades using supply and demand insights.
- See how price finds balance and reacts to supply and demand changes.
- Understand supply and demand versus support and resistance.
Supply and Demand – Short History
But before going in-depth into understanding supply and demand in Forex, I will provide a little history of where supply and demand originated.
The principle of Supply and Demand is one that has been studied for as long as there have been markets, with some references dating back over 2000 years.
The first known published use of the Phrase “Supply and Demand” can be found in Sir James Steuart’s 1770 publication – An Inquiry into the Principles of Political Oeconomy: Being an Essay on the Science of Domestic Policy in Free Nations.
While he focuses mainly on the effect of Supply and Demand with regard to the labour force, the points he outlined set the groundwork for a principle that would forever change how speculators and economists alike viewed any market.
In 1776, Adam Smith wrote in his publication – An Inquiry into the Nature and Causes of the Wealth of Nations; that the market price is regulated by the Demand – the need for the commodity and the Supply – the abundance or scarcity of the commodity in proportion to the need for it and the riches of those who demand it.
If the commodity is scarce, the price of the commodity increases. But if the quantity is more than sufficient to supply the demand, the price decreases.
So, as you can see from the definition above, the Supply and Demand principle is mainly applied to commodities because commodities can be scarce, and their scarcity and how much there is demand for them can affect prices (think of Oil, for example, Wheat, or Soy Beans). However, its principles can also be applied to forex.
What Is Supply and Demand in Forex?
Supply and Demand is a vital part of modern economics and will always affect all aspects of our daily lives.
It is a principle based on two laws, the Law of Supply and the Law of Demand, the interaction of these two laws is what determines the volume of items in the market as well as the price of said items; therefore, the price at which they are traded.
Supply and Demand in Forex, in simple terms, is that all things being equal, the price of a trading asset will increase as the Supply decreases or when the Demand for the trading asset increases above supply.
Inversely, prices will decrease with an increase in Supply or if the Demand for the Trading Asset is less than the Supply.
In normal conditions, the price stays at equilibrium, which is represented as consolidation in price. That is, Supply equals Demand. However, whenever Supply and Demand are not equal, this creates an imbalance in price, causing the price to move outside of its consolidation for a period of time until the price finds equilibrium again at a new price point when the suppliers of a trading assets offer the trading asset at a price that those who demand it are willing to pay for it at the new price.
So, before going into the details of how this principle works in our trading, Let’s look into how these forces, “Supply,” “Demand,” and “Equilibrium” work.
What Is Supply?
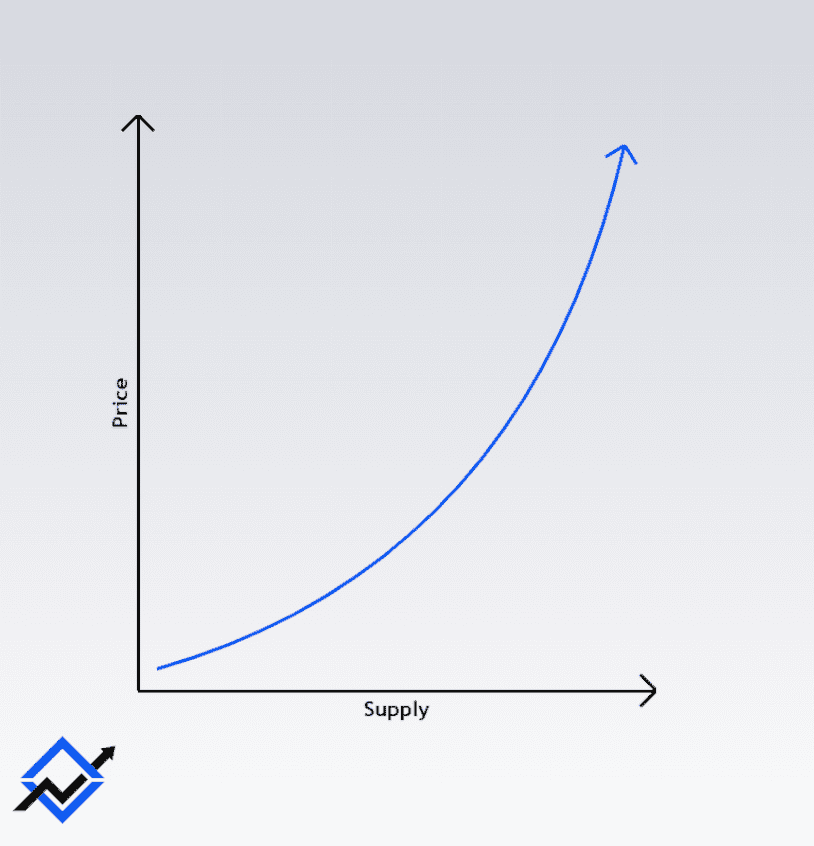
When looking at a Supply curve viewed from the Seller of the trading asset perspective, it represents the relationship between the price and the available supply of a trading asset (Oil, USD, EUR, etc…).
The higher the price of an item, the more incentive there is to sell at higher prices, as there is more opportunity to profit from higher prices.
What Is Demand?
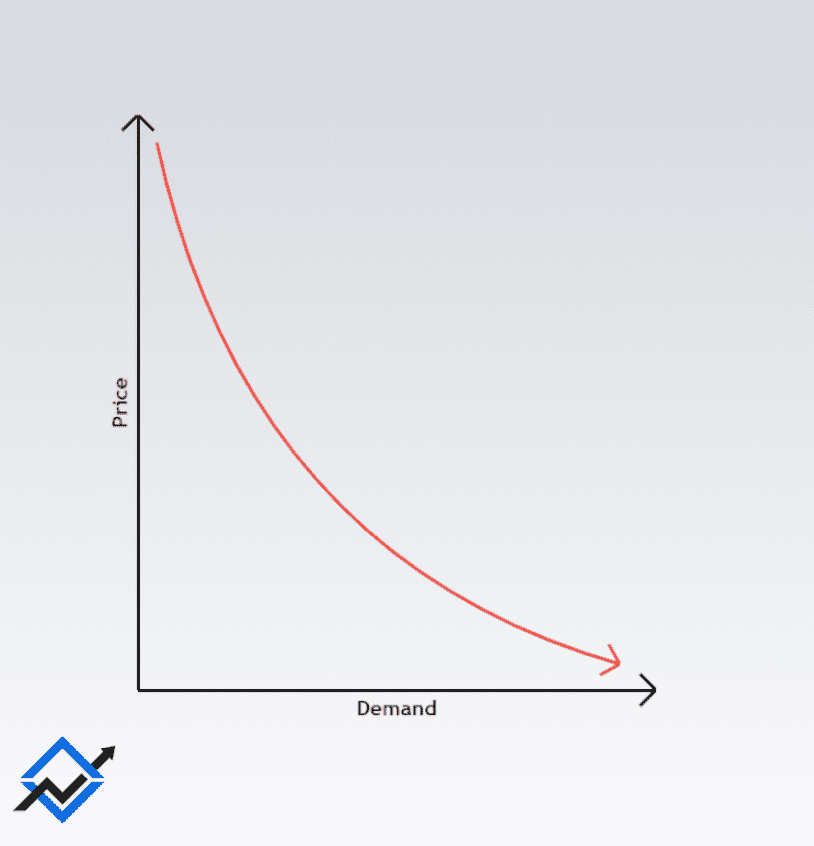
Inversely to the Supply curve, the Demand curve is viewed from the Buyers’ perspective.
It represents the relationship between the price and the quantity of the trading asset in Demand.
The higher the price, the less the number of buyers willing to pay for the price of the trading asset.
When does price reach equilibrium?

As mentioned above, normally, the price would be at equilibrium, and this is represented in consolidation in price action. That equilibrium means that the demand for a certain trading asset meets the supply of that trading asset because buyers are willing to pay for the trading assets the suppliers are offering and which buyers deem reasonable. This is what we call a “Fair Price”, hence why the price stays in consolidation at equilibrium.
However, when there is a change in the balance of Supply and Demand, the price will exit its Equilibrium status, forming an Imbalance in price. That is usually represented by an impulsive price move when it moves outside of equilibrium/consolidation.
Later down, I will go into more detail on how you can profit from these impulsive price moves and how you can trade them profitably for supply and demand forex trading.
The 6 States of Price in Supply and Demand in Forex Trading?
When we look at Supply and Demand to trade in the forex market, we are not interested in looking at it from an economic point of view. Instead, we are interested in seeing how these changes in Supply and Demand in Forex would affect price movement and the strength of the move to understand better whether a move is worth taking or not.
Let’s take as an example EURUSD; generally, these 4 scenarios occur in low probability conditions, leading to low probability trades after the price moves aware from the consolidation.
Increase in Supply
- Sellers of USD increase (while the Demand for EUR is the same), causing the price of EURUSD to decrease.
- This is usually represented as a weak Sell of EURUSD.
- The down movement in price here is caused by the increase in the Supply of USD compared to the contestant Demand for EUR, which causes the prices to fall.
- The price movement in this scenario is choppy and slow. It trends downward but in a very slow back-and-forth movement. These are usually low-probability conditions for taking a trade.

Decrease in Supply
- Sellers USD decreases (while the Demand for EUR is the same), causing the price of EURUSD to increase.
- This is usually represented as a weak Buy of EURUSD.
- The upward movement in price here is caused by the decrease in the supply of USD compared to the contestant Demand for EUR, causing the prices to rise.
- The price movement in this scenario is choppy and slow. It trends upwards but in a very slow back-and-forth movement. These are usually low-probability conditions to take a trade.

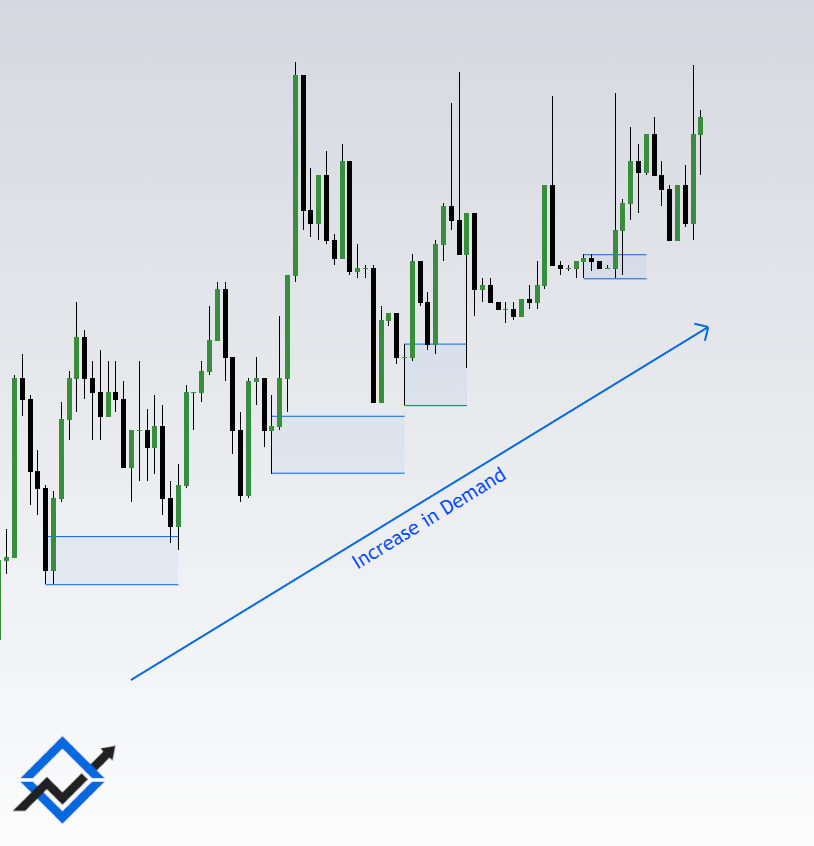
Increase in Demand
- Buyers of EUR increase (while the Supply of USD is the same), causing the price of EURUSD to increase.
- This is usually represented as a weak Buy of EURUSD.
- The upward movement in price here is caused by the increase in the demand for EUR compared to the constant supply of USD, which causes the prices to rise.
- The price movement in this scenario is choppy and slow. It trends upwards but in a very slow back-and-forth movement. These are usually low-probability conditions to take a trade.
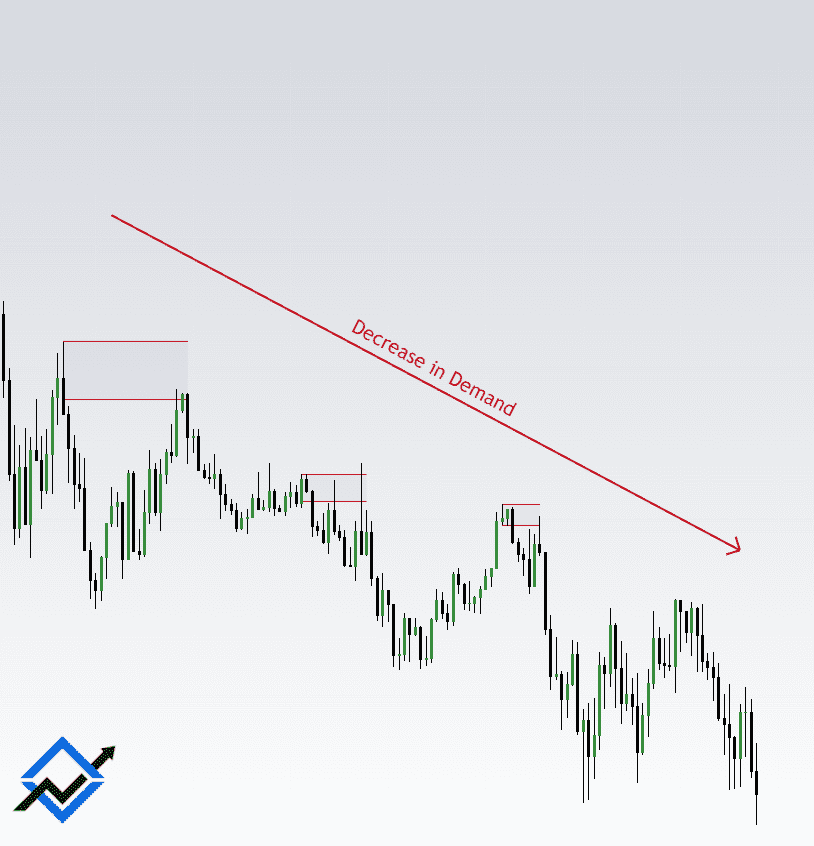
Decrease in Demand
- Buyers of EUR decrease (while the Supply of USD is the same), causing the price to decrease.
- This is usually represented as a weak Sell of EURUSD.
- The down movement in price here is caused by the decrease in the Demand for EUR compared to the constant Supply of USD causing the prices to fall.
- The price movement in this scenario is choppy and slow. It trends downward but in a very slow back-and-forth movement. These are usually low-probability conditions to take a trade.

However, our job as Smart Money Concepts traders is to find high-probability trade conditions that will lead to high-probability trades to ensure profitability in the long term. These high-probability conditions occur when the Supply and the Demand of the same Trading Asset change simultaneously. That’s when the price creates an Imbalance in Price, causing the price to move in one direction with strong momentum. That’s when you should be capitalising on trades with high Risk to Reward ratios. There are only 2 simple scenarios for this to occur:
Increase in Supply + Decrease in Demand
- Buyers of EUR decrease, while the Supply of USD increases at the same period of time, causing the price to decrease with a strong directional move.
- This is usually represented as a strong sell of EURUSD.
- The price movement in this scenario is fast, with a strong moment to the downside with a sustained down move.
- These are usually high-probability conditions to take a trade.

Decrease in Supply + Increase in Demand
- Buyers of EUR increase, while the Supply of USD decreases at the same period of time, causing the price to increase with a strong directional move.
- This is usually represented as a strong Buy of EURUSD.
- The price movement in this scenario is fast, with a strong moment to the upside with a sustained up move.
- These are usually high-probability conditions to take a trade.

How Does Supply and Demand Apply to Forex Trading?
As we now know, Supply and Demand are relative to items bought and sold; they also apply to forex trading. While we aren’t buying an actual commodity like Wheat or Soy Beans, we are still buying (and selling) an item, which in this case is our chosen currency, for example, EUR against USD.
The same principles apply, there are changes in the Supply and Demand of a currency against another currency, and the exchange price will increase or decrease accordingly until the price finds another point of equilibrium/consolidation.
Most modern trading platforms allow us to see prices in a graphical sense; it becomes easier for a trader to get a view of the market psychology as a whole and what other buyers and sellers perceive as premium (overbought) and discount (oversold) prices, and what they perceive as a “Fair Price” at the equilibrium /consolidation.
By reading price action and the movement of the candles as price prints new highs and lows, you would be able to see where Supply exceeds Demand and where Demand exceeds Supply.
So, by following this price action, you could start to map out areas of price where there was an imbalance between Supply and Demand and reasonably expect there to be a similar reaction when the price makes its way back to these areas in the future.

Now that we have an understanding of the process behind the principle of Supply and Demand, let’s get onto the reason we are here: how does this apply to our trading?
What Do Supply and Demand Zones Look Like
By going through the process outlined in the previous section, we can start to see what patterns will print on our charts in response to the forces in the market.
And marking them will give us a point of interest or zone to wait for a reaction.
Supply and Demand Zones are sometimes compared to Order Blocks; while they can appear similar, they present under a different narrative; a further study into Order Blocks and the market condition that causes them to print on our charts can be found in another article, Order Block in Forex, 4 Insane Rules to Add to Your Strategy.
It is important to remember that the charts we see and the patterns they print are nothing more than patterns and have no bearing on the future movement of price, but rather that the patterns are the result of the narrative at play and the exchange between buyers and sellers.
Let’s look at how they show up on our charts.
How to find demand zones
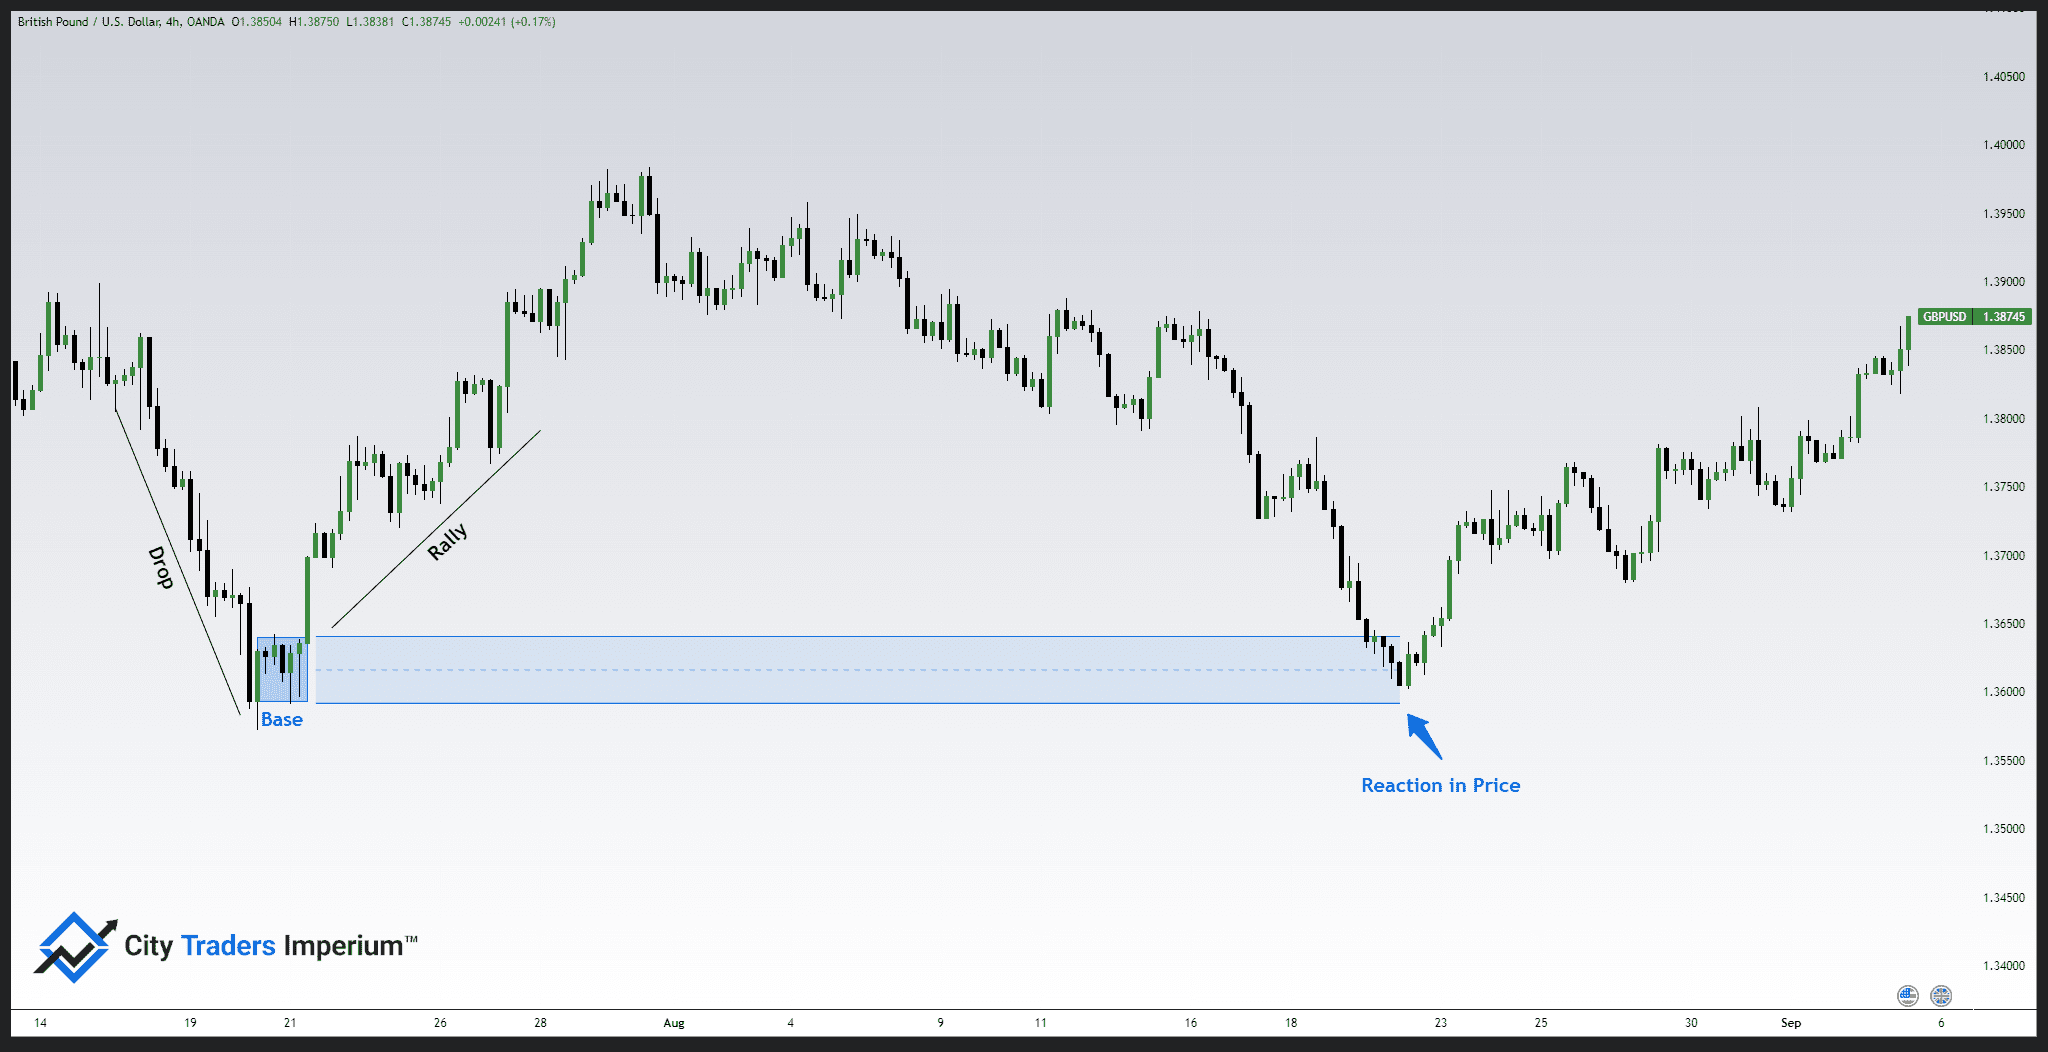
Scenario 1
The price moves down attracting more buyers, as the buying interest increases, a moment of equilibrium is reached, and then the price rallies away.
We call this pattern Drop – Base – Rally (DBR)
When the price returns to the Demand Zone marked out by the Base, we can reasonably expect a reaction in price.
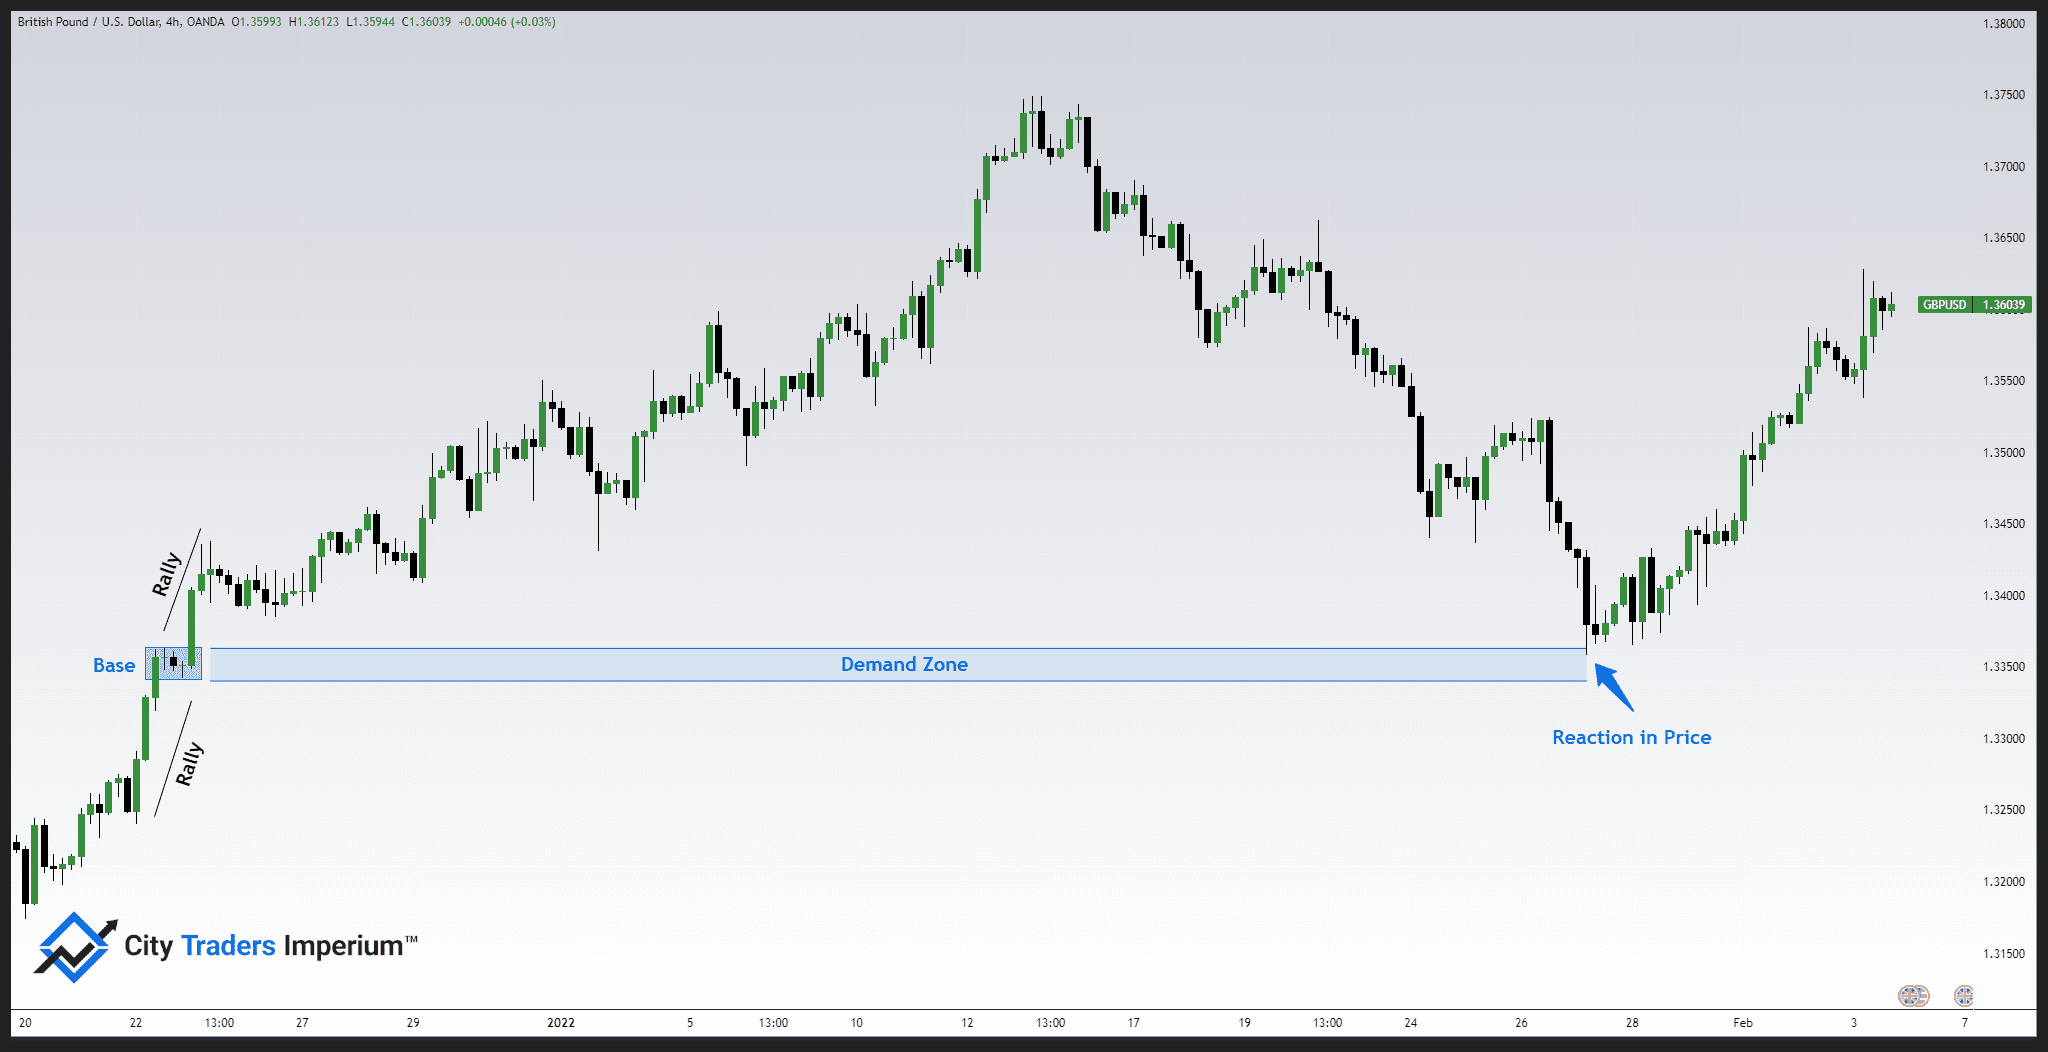
Scenario 2
The price moves up, driven by high demand, and sellers start to enter the market until a moment of equilibrium is reached between the Demand and the Supply. But the demand is too high and there is not enough supply. Again, an imbalance occurs and the price rallies away from the Demand Zone.
This pattern is called Rally – Base – Rally (RBR)
Again, when the price returns to the Demand Zone marked out by the base, we can reasonably expect the price to rally again.
How to find Supply zones
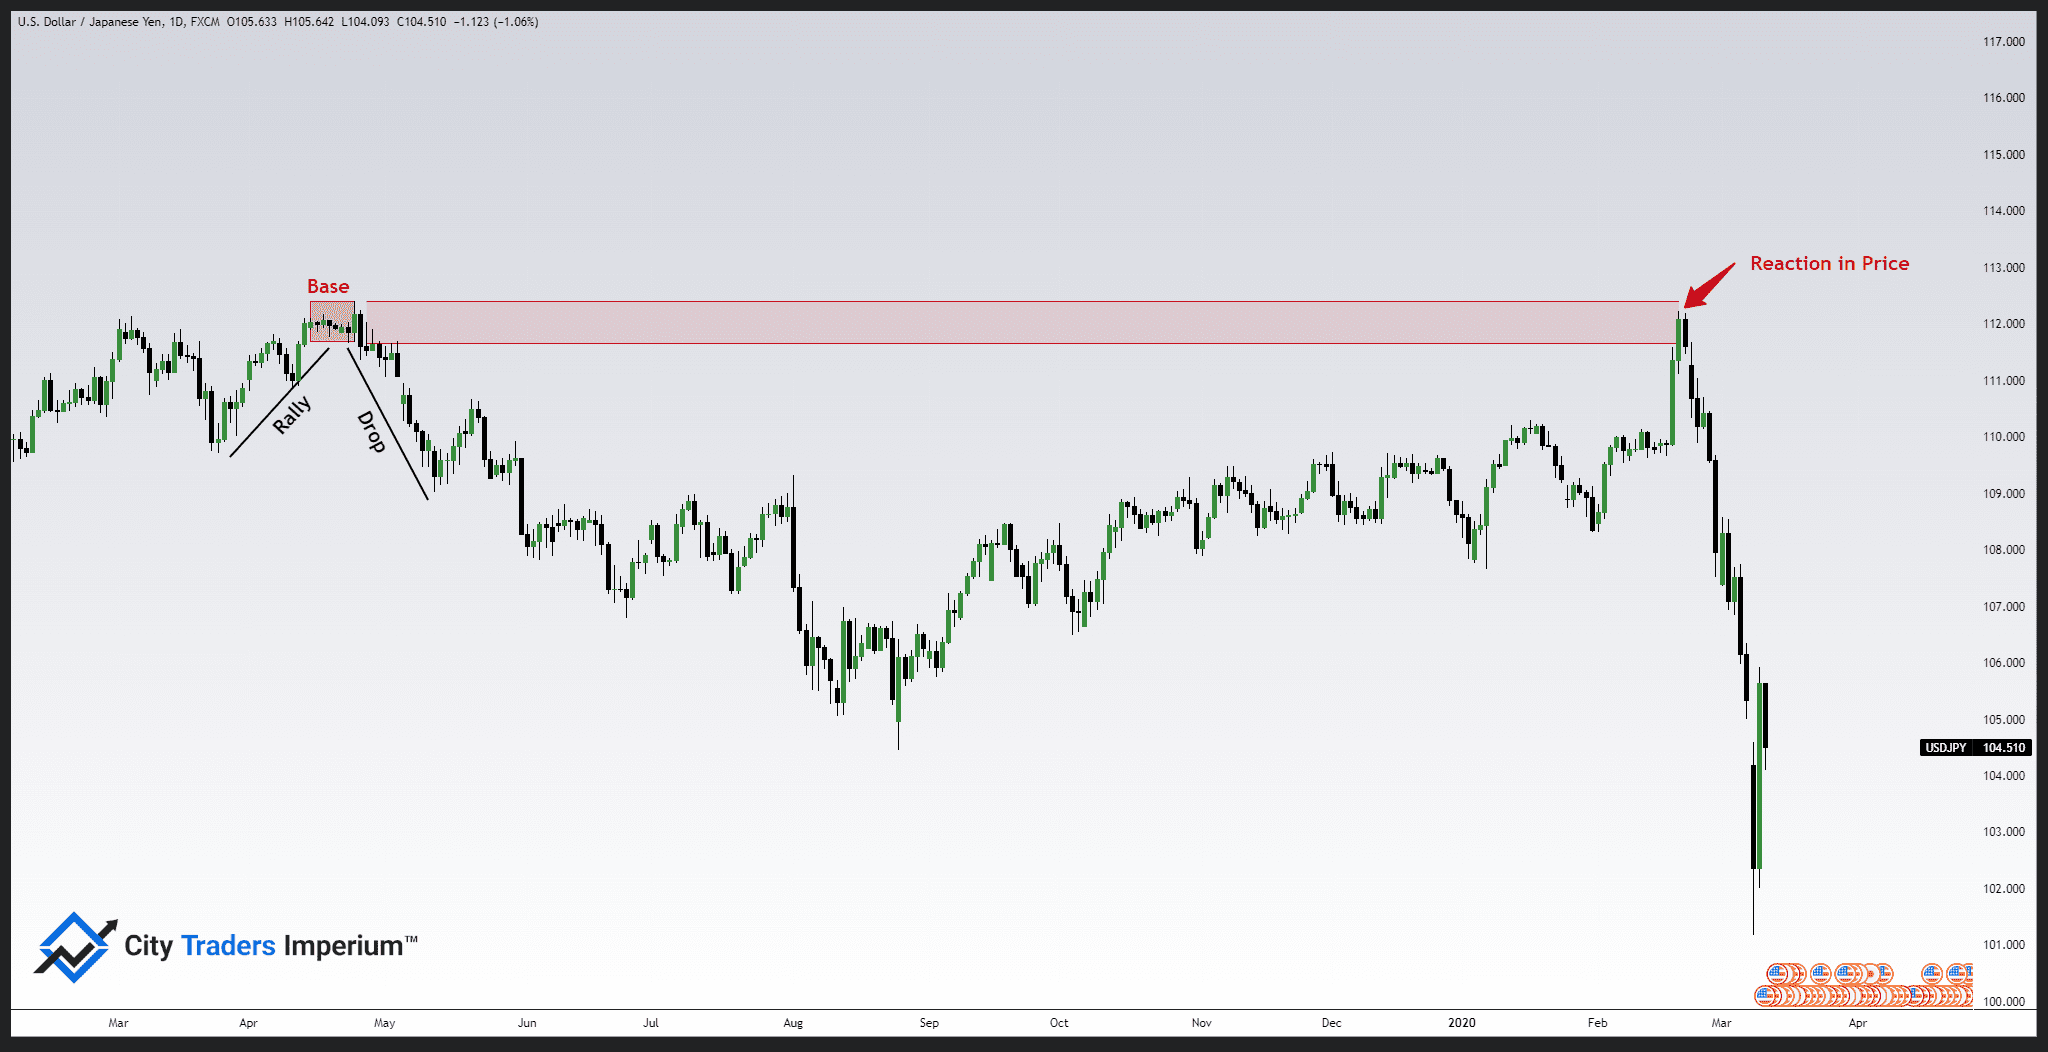
Scenario 1
Inversely Supply zones are going to be formed when the Supply is greater than the Demand and creates an imbalance, from which price will move away. Much like the Demand Zones, these patterns print because of the underlying narrative at play.
This pattern is called Rally – Base – Drop (RBD)
When the price rallies to a Supply Zone, the Demand to the Point of Interest (POI) finds equilibrium before the price reverses to continue its move downtrend.
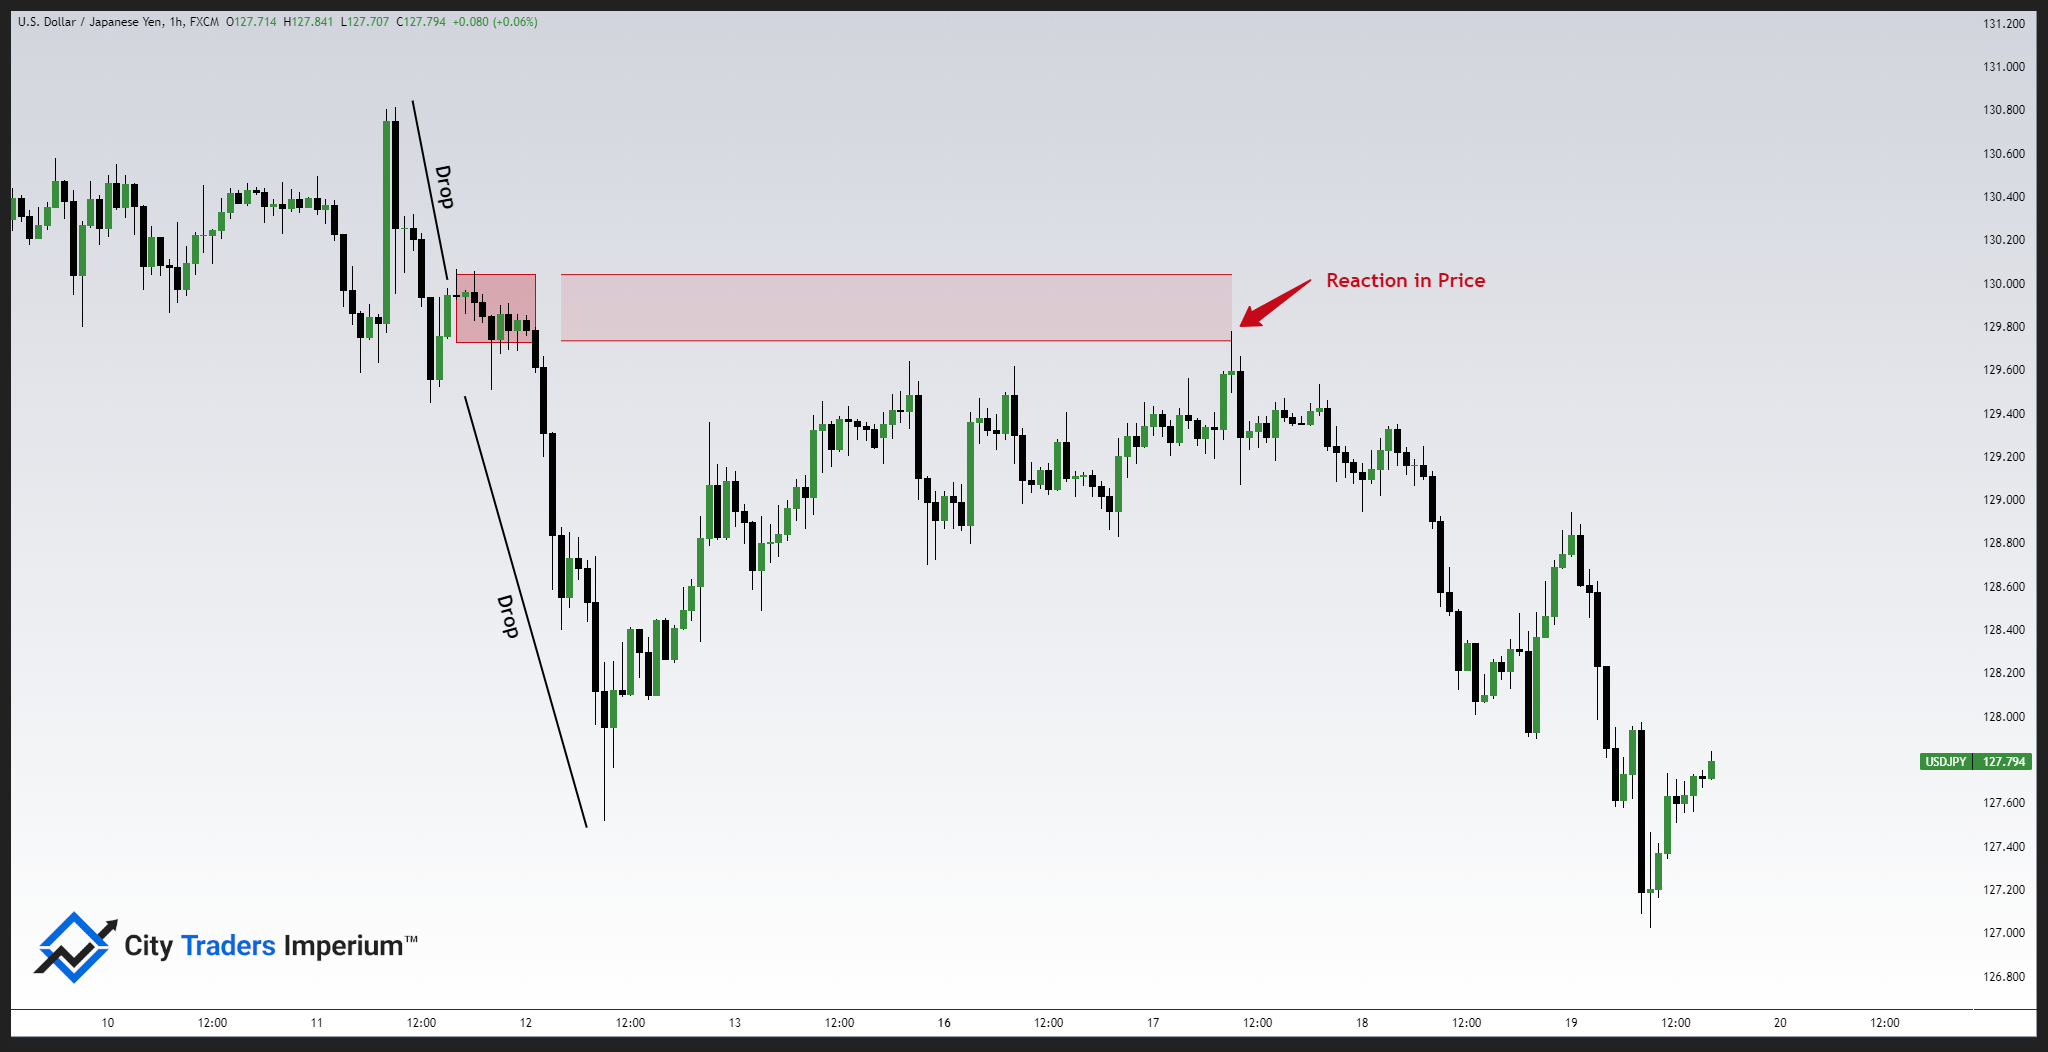
Scenario 2
The price has already moved down, pushed by Supply, the price consolidates a little before the price drops again.
This pattern is called Drop – Base – Drop (DBD)
When the price rallies to a supply zone, the demand to the point of interest (POI) finds equilibrium before the price reverses to continue its downward trend.
When are Supply and Demand zones valid?
The 2 most important factors when considering the validity of Supply and Demand Zones in Forex are:
- The Base: The amount of time the price stays at Equilibrium before moving in the direction of the stronger players in the market. This should be clear and not continue on for an extended period of time (it varies by time frame but a good rule of thumb is 1 to 5 candles).
- The Drop away from the Base must break the market structure.
A clear understanding of Market Structure is an important skill to have when considering Supply and Demand zones. We have made an extensive video explaining this below.
How to Find Weak and Strong Supply & Demand Zones?
One could, as a pure Supply and Demand trader, trade these zones as they appear in the previous examples by waiting for the price to return to a Supply or Demand Zone and placing a trade as the price reaches the Supply or Demand Zone with a Stop Loss on the other side of the Zone, we should have a profitable supply and demand trading strategy.
One possible way is if you were to use Supply and Demand Zones as the backdrop or filter to your current strategy. You could start building on a higher timeframe analysis by waiting for the price to return to these levels and then use your current strategy on a lower timeframe as confirmation. This way, you would filter out the false signals that so often catch retail traders out. Doing this will drastically increase the probability of your trades winning, thereby increasing the win rate and, in turn, overall profitability.
Let’s look at an example.
In a previous article, The Most Powerful Reversal Patterns in Forex You Must Know, we looked into the highest probability reversal patterns and how to trade them successfully by applying Smart Money Concepts, such as Supply and Demand, Order Blocks, etc…
In the article, we discussed how it is possible to increase the probability of reversal patterns by trading them when the price is at a higher timeframe point of interest.
So let’s look at how Supply and Demand on a higher timeframe act as a filter to increase the Probability and, therefore, Profitability of a fairly simple reversal pattern.
By using higher timeframe Supply and Demand Zones as our higher timeframe point of interest, will this improve our trading?

In the above example, we can see that by using something as simple as an Engulfing Candlestick Bearish Reversal Pattern,
You will see very quickly how many false signals we would have traded without considering the Supply Zone, and in doing so losses absorbed, before finally getting a winning trade, and still, we would have a limited idea as to where our target placement would be.
Again, by using the Principle of Supply and Demand, we are able to set higher Risk to Reward trades, and take fewer losses because it will help you filter out trades that are not at important key levels turning the relatively simple reversal patterns into a profitable trading pattern.
Supply and Demand vs Support and Resistance Levels
So the thought that usually follows after an initial study into the Principles of Supply and Demand is “That looks a lot like Support and Resistance.” From an uninformed perspective, they do look a little similar, but the mechanics behind each principle paint different pictures.
While a Supply or Demand Zone is an area of possible Accumulation or Distribution of orders and the Imbalance in either the Supply or Demand causes the price to move away from that area, then as a Supply and Demand trader, one could then expect a reaction when price returns to the Zone for the first time.
Support and Resistance, on the other hand, is of the view that each time a level is tested and not broken, it becomes a stronger level of Support or Resistance.
But if we look at the Narrative behind price returning to a level, it would be one of the orders being filled each time price returns to that level, we could then see that the more times a level is tested, the more likely it is to fail as the Supply pushing back to a Support Level (Demand Zone) and Demand pushing back to a Resistance Level (Supply Zone) will eventually overwhelm the orders available (Liquidity) at the level and the level will not hold.
Final Thoughts on Supply and Demand in Forex Trading
So in closing, we can come to the conclusion that Supply and Demand alone, while in theory would have the makings of a profitable strategy that they fare a lot better as the higher timeframe foundations of a reversal strategy, and in doing so making that reversal strategy a far more lucrative one.
As traders are naturally always in search of ways to improve some aspect of their trading, adding principles like this seems a logical addition in a trader’s journey to consistent and higher profits.
While this idea seems simple, the nuances of Smart Money Concepts do run deeper than what can be covered in this one article; for further study of these concepts and to learn an already profitable strategy using all these Smart Money Concepts combined, a look into Bank Level Trading will offer a way to drastically shorten the learning curve and how to use all combinations of Smart Money Concepts elements together.