


Introduction
Support and Resistance is one of the first concepts learned in any traded market. It doesn’t take a genius to figure out that price always bounces off the same areas.
A move can begin from one level and revisit the same place a year later to produce the same result. This phenomenon is apparent with all trends and reversal patterns in the market.
On the other side of the coin, we have Supply & Demand.
Both these trading methods are used to look at the same bounces from point A to B at certain levels, predicting turning points. However, while closely related, Support & Resistance and Supply & Demand aren’t the same.
Subtle differences exist. We’ll cover those in more detail below…
Key Findings
- Supply–demand zones represent institutional order flow—areas where Smart Money accumulated or distributed, sparking prior rallies or drops—while support-resistance marks historical price ceilings and floors.
- Focus on the move origin distinguishes methods: supply-demand traders target the impulse’s starting zone; support-resistance traders revisit flipped levels of past support or resistance.
- Recency matters more in supply-demand; newer zones draw Smart Money re-entries, whereas support-resistance often references months-old levels for anticipated reactions.
- Support-resistance is drawn as precise lines; supply-demand uses broader zones, allowing price to overshoot lines, create false breaks, and trigger stop-hunts.
- Combining a demand or supply zone with a nearby support-resistance line lets traders exploit bull/bear traps and improves confirmation of high-probability turning points.
Support & Resistance vs Supply & Demand: The Overview
Before going into the contrasts of Supply and Demand vs Support and Resistance, it makes sense to break down the concepts individually.
Let’s start with Support & Resistance.
What Is Support and Resistance?
Support and Resistance refers to the occurrence of price levels acting as barriers that prevent the market from moving beyond them.
Support acts as the ‘floor’ when a market is moving down, while resistance acts as the ‘ceiling’ when a market is moving up.
Another key component is the reversal roles of Support and Resistance. So, what is a support area now flips into a resistance area in the future, and vice versa.

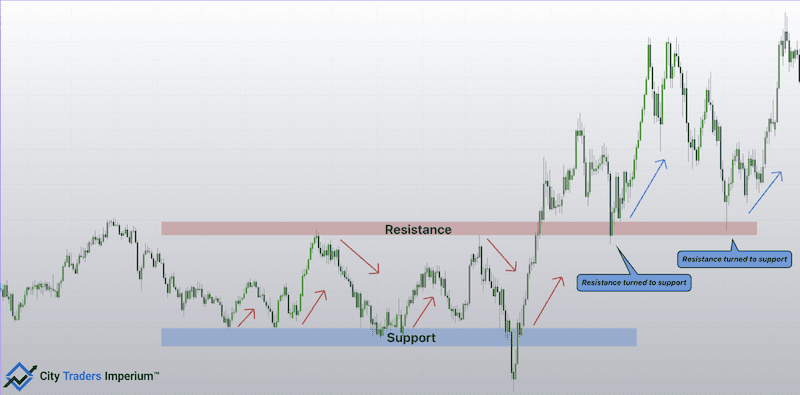
A market’s natural state is to move in a step-like motion of impulses and retracements. Support and Resistance plays a significant part here, leading us to the next question: what causes it?
The simplest answer is Supply and Demand. This is where both concepts cross over into each other. The appearance of a support level means more buyers than sellers, while a resistance level signifies the presence of more sellers than buyers. There are several reasons why such a shift exists.
Technical analysis is mostly a self-fulfilling prophecy.
Every trader can see the key Support and Resistance on a chart. What causes one level to produce the expected outcome compared to another is the level of interest or Supply and Demand.
What Is Supply and Demand?
Supply and Demand is a trading methodology popularised by Sam Seiden in the early 2010s. The approach centres around economic Supply and Demand, the Wyckoff Method and ‘Smart Money‘ concepts.
Supply and Demand is an advanced form of Support and Resistance based on zones of previous rallies (or distribution) and drops (or accumulation).
A supply zone is an area of keen selling interest, while a demand zone is an area of keen buying interest. We expect a greater drop from a supply zone (based on the fact that the price moved similarly before).
On the other hand, we anticipate a greater rally coming from a supply zone (based on the previous move of similar magnitude).
Supply = selling interest
Demand = buying interest

Now comes the golden question: what causes supply/demand zones?
Like Support and Resistance, it’s a self-fulfilling prophecy. However, the theory that’s become accepted in the trading world is institutional order flow. This is where Smart Money comes into play. What do we mean here?
All traded markets are divided into retail traders (the average person) and institutional traders (the Smart Money).
Smart Money represents the biggest and most monied players, particularly banks. The belief is that these entities cause changes in Supply and Demand forces due to their enormous and unmatched trading power.
Despite this, Smart Money traders cannot place their positions like retail traders because of the size. For every buyer, there needs to be a seller and vice versa. If you’re selling a mere standard forex lot, that’s a tiny size where there will always be demand to fulfil the order.
It’s a different story for groups trading hundreds of lots at a time. Fewer buyers will exist to meet the demand if you’re selling that much volume.
This means that only a tiny portion of your order would get filled. This causes the price to drop as the trading platform looks for buyers along the way to fulfil the rest. The problem is that such an occurrence produces a worse entry price, reducing the overall profit.
The solution is placing the huge position in smaller chunks around a similar price. Each execution pushes the market in the intended direction. The hope is that the market will return to the same area for Smart Money to fill in the remainder of the order. This is because, by this time, thousands of traders would be on the opposite side, allowing for a favourable entry.
Supply and Demand vs Support and Resistance: The Differences
While closely related, Supply & Demand and Support & Resistance come with three key differences that traders must be aware of. These are:
The Origination of Moves
Earlier, we spoke about how the ‘role reversal’ of Support and Resistance works. It’s common for traders to look for opportunities in areas where support was previously resistance and vice versa.
There is nothing wrong with this approach. It’s all about perception. Supply and Demand traders are concerned about where a move started, not the support or resistance. Let’s explain this concept with an example.
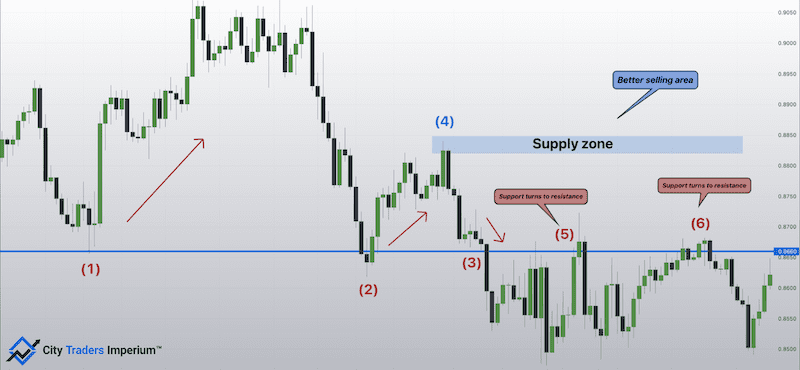
Pay attention to the support level at 0.8660. At the spot marked (1), we see a rally. The second spot (2) shows a rally (though smaller than the first).
The market eventually breaks the level at (3). However, it retraces to 0.8660 and appears to find resistance at (5) and (6). These would represent optimal selling levels. Yet, Supply and Demand traders would choose the spot marked (4) as the better choice due to the strength of the impulse.
Of course, (5) and (6) are technically also Supply and Demand zones. However, (4) is still more optimal.
Let’s look at another example, this time a demand zone.
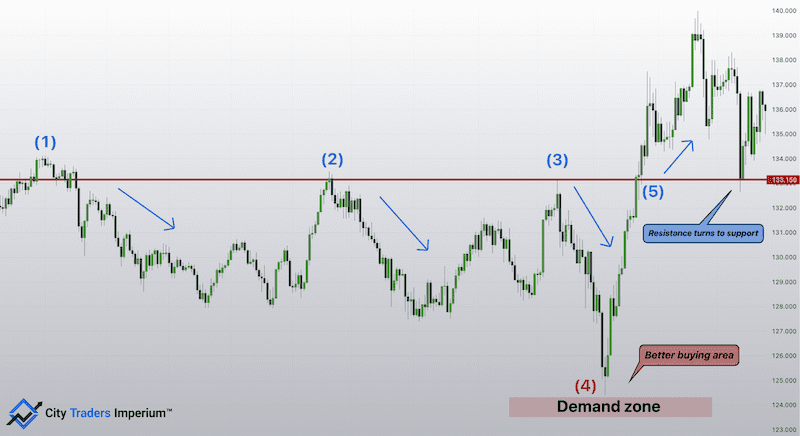
We have our resistance at 133.150. Notice the drops from this level at (1), (2), and (3). The market breaks the area at (5) and drops back to the same place, turning it into support. However, the region of interest is the demand zone at (4), which breaks the resistance.
(1), (2), and (3) at the resistance may have historical context but are less effective for buying. We would be more concerned about where the rally began at (4).
This leads us to the next difference when exploring Supply and Demand vs Support and Resistance: recency.
Recency
When Sam Seiden introduced Supply and Demand, he stated that old zones were as effective as recent ones. However, many proponents debate this concept, and there’s evidence to prove this. You can find Supply and Demand levels from months and years ago that caused turning points.
However, Supply and Demand traders are not concerned about old levels. On the other hand, Support and Resistance depends more on historical price data. You often need to go back to your charts several steps before saying a level is support or resistance.
This isn’t necessary when trading Supply and Demand. Many believe that newer zones are more likely to produce a sizable move. The theory is that Smart Money want to place their remaining orders as soon as possible. An older zone has less interest for them, given the long time that would have passed.
Let’s look at an example.
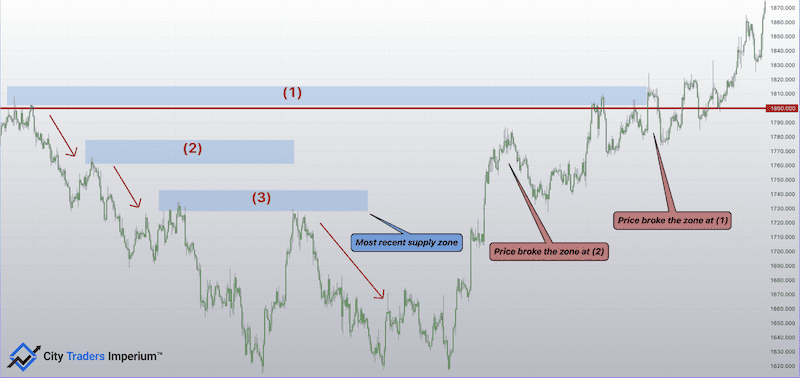
We have labelled three supply zones on this chart: (1) is the oldest, (2) is the second-oldest, and (3) is the least old. Notice how the price dropped nicely from the most recent zone but penetrated (2) and (1). The marked 1800 resistance area would have been a level of interest. Yet, it formed a month before (3).
By the time the market returned to it, more time would have passed, making it less effective. Overall, this isn’t to say that older areas don’t produce big moves. Yet, most Supply and Demand traders prefer newer zones.
Here’s another scenario, this time looking at demand zones: (1) and (2).
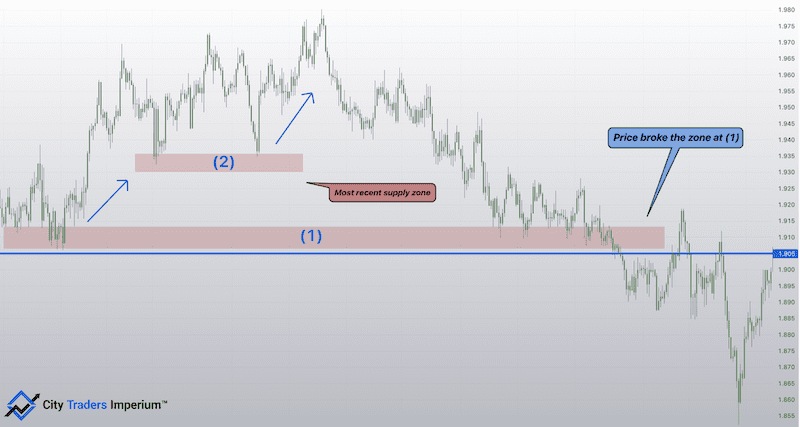
(2) was the most recent demand zone, where the price rallied considerably once it returned. (1) is the oldest zone but failed to produce the same result.
Most traders believe the size of the move from the zone affects Supply and Demand. Yet, in recent times, many have taken a different approach due to recency. Certain kinds of zones work better than others (we go into more detail about this here).
Lines vs Zones
Another distinction between Supply and Demand and Support and Resistance is that we often refer to the former as a precise level or line, while we consider the latter a zone.
Think about it this way:
If those two indicators told time, Support & Resistance would say that the time is 14.30. Supply and Demand, however, would say that it’s nearly 14.30.
The good thing about using zones is that traders anticipate an approximate area for a pivot point.
This means the price doesn’t need to turn at a strictly defined area to consider its strength. Traders face two problems when observing Support and Resistance.
The first is the expectation of the market returning to a precise level. Secondly, even when it does, it’s common for the market to appear like it will pass through that area, only to do a U-turn. In the next section, we’ll explore how you can use this to your advantage.
For now, let’s look at an illustration.
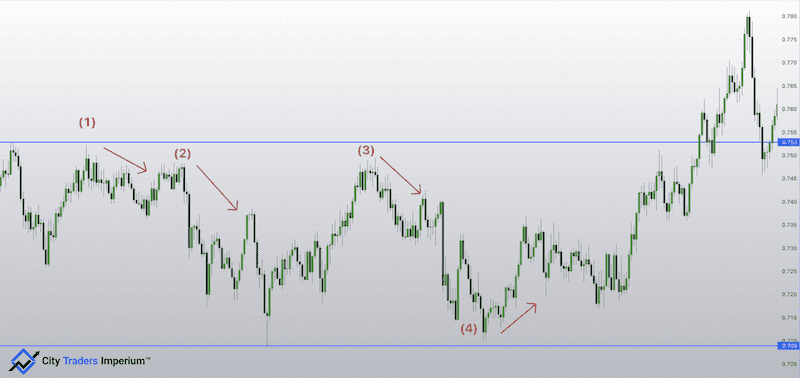
We have marked the Support and Resistance at 0.709 and 0.753, respectively. (1), (2), and (3) show us how close the market was to touching the 0.753 resistance. But in each case, the price dipped considerably. The same can be said for (4); the market was almost exactly at the support level but managed to rally.
Combining Support and Resistance with Supply and Demand when Trading
It is certainly possible to combine the two. After all, Support and Resistance and Supply and Demand are not polar opposites.
Aside from the slight differences, both techniques attempt to determine pivot points in the market. The primary method of combining these two elements is having a defined level along with a zone on a chart.
Remember, we mentioned that the price does turn near a level, but not precisely. However, there are plenty of times when the market reverses once passing through that area. We call this a false break (or bull/bear trap), a concept we expand on in our order flow piece here.
In short, it’s a case of ‘stop loss hunting.’ Unsuspecting traders like to place their stop losses at precise Support and Resistance. These areas represent great opportunities for Smart Money to fill the rest of their positions. You can be like them by anticipating the market to hit a Support and Resistance level after entering a Supply and Demand zone.
We’ll look at two scenarios.
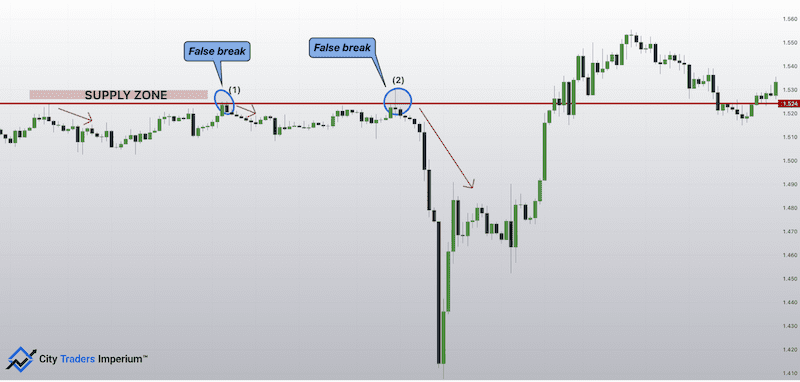
The chart above shows a nice resistance level at 1.524, along with a supply zone. Notice the two false breaks at this price. The best way to identify bull or bear traps is with price action by looking at engulfing or inside bar patterns (as with point 1) or candles with long wicks (as with point 2).
These represent rejection and are classic signs of stop hunting. The spot (2) proved more powerful due to the length of the wick, resulting in a substantial decline afterwards.
Let’s observe another illustration.
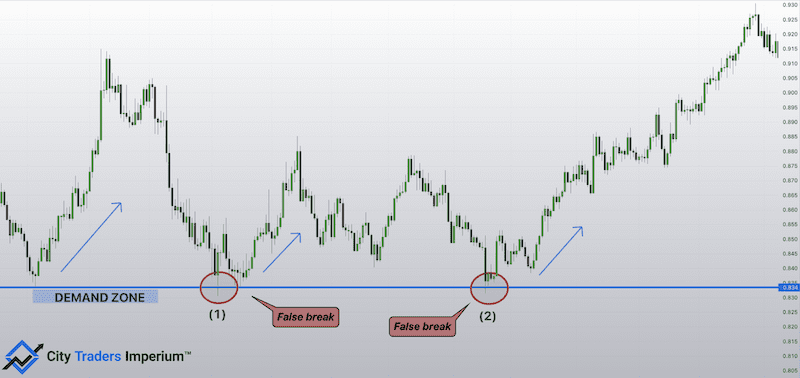
Here, we have a demand zone or resistance at 0.834. Notice the false breaks at the points marked (1) and (2), long wicks, and strong bullish candles.
In both cases, the market rallied from the same spot, more so with the second resistance touch.
Conclusion: Is Supply and Demand the Same Thing as Support and Resistance?
Ultimately, very little separates Supply & Demand and Support & Resistance.
Everything comes down to how you interpret each one. They both aim to achieve the same premise: acting levels where the dynamics have shifted from one side to another.
As with other trading techniques, context is vital. Supply and Demand or Support and Resistance can form the foundation of a set-up. However, the success of that opportunity becomes greater when you combine it with other confirmation factors in your strategy.