


Spotting a Flag Could Be Your Next Winning Trade
Bull Flags and Bear Flags are continuation price chart patterns in technical analysis. It allows traders to forecast the direction of the trend after consolidations, where, depending on the underlying trend, Flags can be Bearish or Bullish.
In this article, we will examine Bull Flag vs Bear Flag chart patterns and how they can be traded using retail trading methods. We will also explore how you can combine it with Smart Money Concepts to increase your risk-reward ratio and have higher probability trades.
Key Findings
- The continuation flag pattern signals a trend resumption after a sharp “flagpole” move and brief consolidation; bull flags typically appear in uptrends, while bear flags typically appear in downtrends.
- Reliability hinges on institutional order flow: flags remain valid only as long as price targets are unaffected by liquidity zones on higher-timeframe charts.
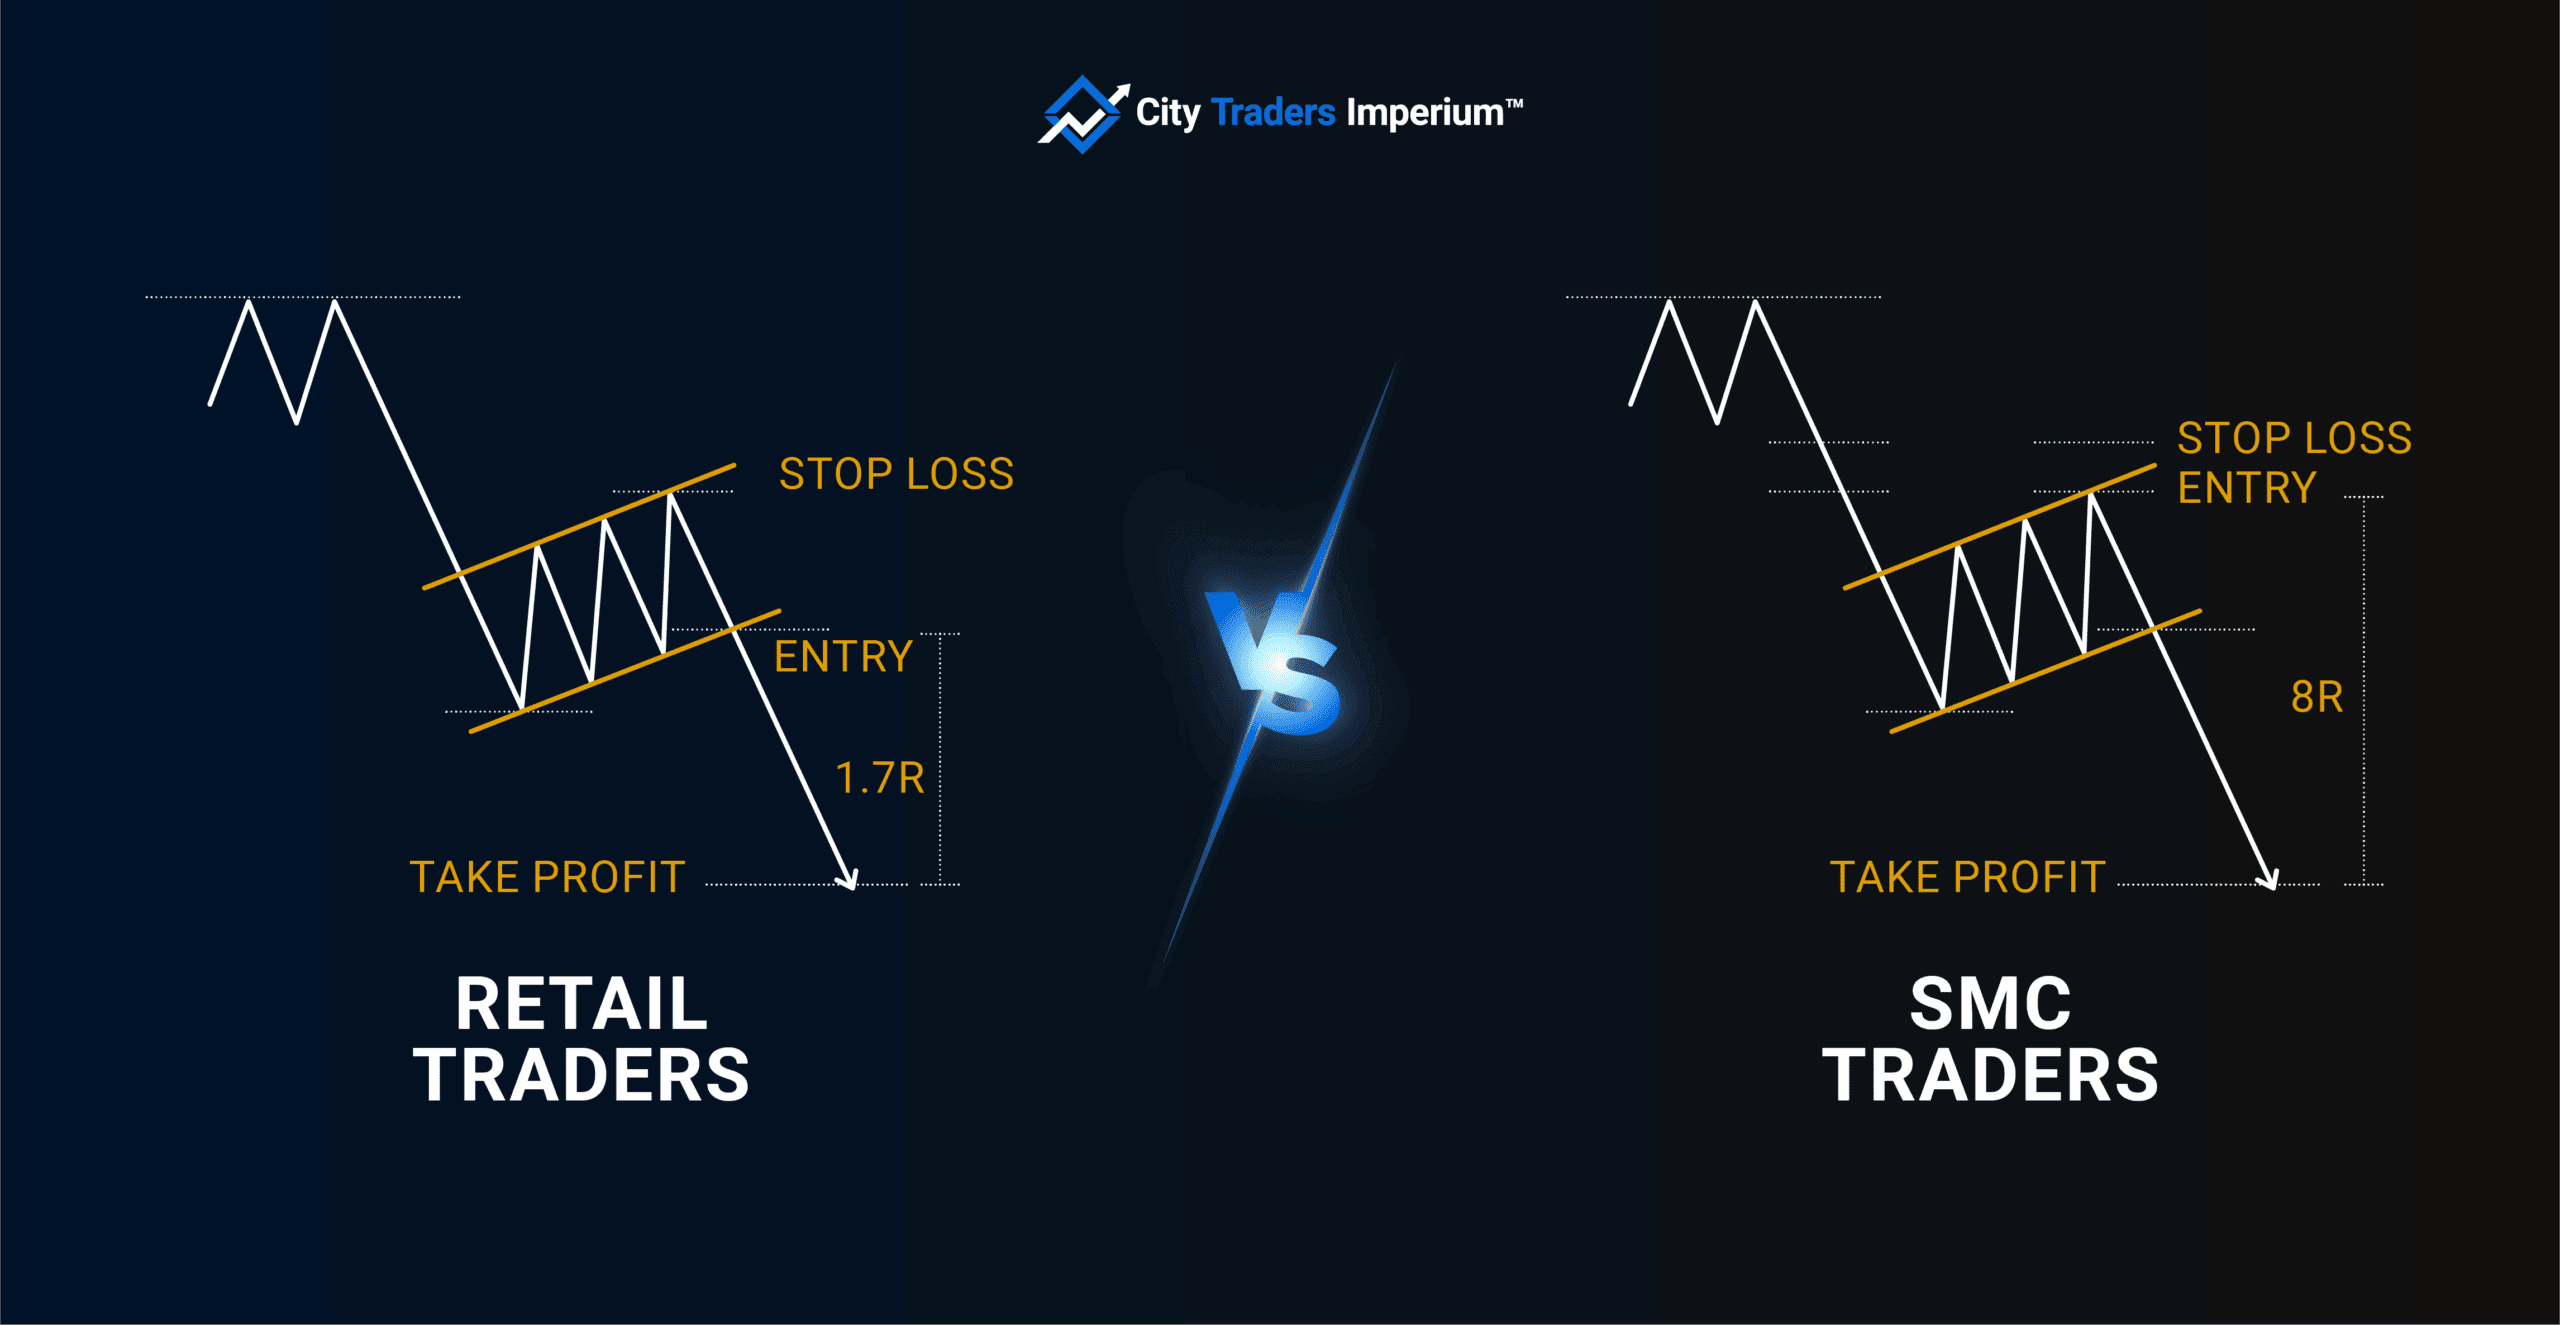
- Retail breakout entries at flag extremes often face frequent stop-hunts and wide stops, resulting in modest risk-reward ratios near 1.7:1.
- Smart Money Concepts entry — waiting for a liquidity sweep, then using an order block — can boost the risk-reward ratio to approximately 14.3:1 with tighter stops.
- Trading flags without market-narrative context, especially after liquidity has already tapped, often yields pattern failure and premature stop-outs.
What Are Flag Patterns?
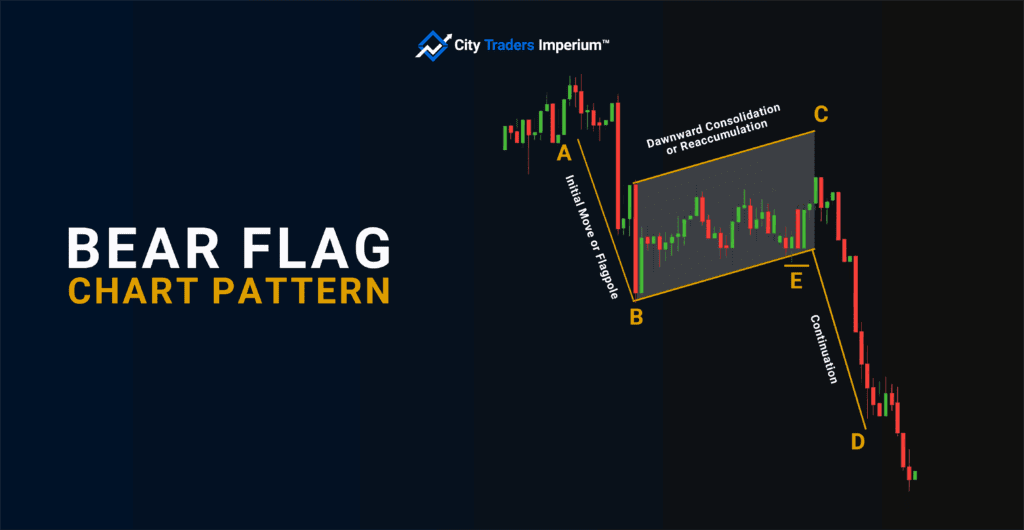
A flag pattern is a short-term consolidation that forms after a strong price move. It often resembles a small parallelogram or rectangle sloping against the main trend.
According to Investopedia:
“A flag is a price pattern that, in a shorter time frame, moves counter to the prevailing price trend observed in a longer time frame on a price chart.”
Flag patterns are continuation patterns, not reversals. That means they suggest the dominant trend is likely to continue once the pause (the “flag”) resolves, giving you a chance to trade with momentum instead of against it.
A Bull Flag forms after a sharp upward move (the pole), followed by a small downward-sloping consolidation (the flag), before breaking higher.
A Bear Flag works in reverse — sharp drop, brief upward pause, then continuation lower.
Anatomy of a Bull Flag / Bear Flag
Flag patterns share a three-part structure that repeats across markets and timeframes:
Flagpole: A strong, near-vertical move (up or down) that kicks off the pattern, ideally with increasing volume.
Flag: A brief, tight consolidation that slopes against the dominant trend, usually less than 45° in angle.
Breakout: A resumption of the original move, confirmed by a decisive break from the flag and rising volume.
Whether bullish or bearish, this structure offers a clean visual cue for potential continuation trades.
💡 Pro Trader Tip: Bull Flags and Bear Flags are “Patterns”. They form as a result of the price being in consolidation after a sharp move, creating a pattern that resembles a flag and a pole. Hence their name, Bull and Bear Flag Patterns. However, without a real understanding of the underlying Market Narrative (what the price is doing now, and where it is likely to go next), you could easily fall victim to market manipulation and be stopped prematurely or be on the wrong side of the trade altogether. |
Why Do Bull and Bear Flags Patterns Occur After Trends?
In Smart Money Concepts, the term “Accumulation” can be a synonym for the term “Flag” in the Bull Flag Pattern. Also, “Distribution” in a Bearish Trend can be a synonym for the term “Flag” in Bear Flag Patterns.
Distribution and Accumulation explain why the consolidation is taking place. They also provide an idea about where to place a trade entry at a much better price, allowing for a lower-risk entry.
The price seeks liquidity 24/7, and without liquidity, there wouldn’t be any market movement. So, when the market moves in a specific direction for a while (Bearish Trend), it reaches a point where it has exhausted all the present liquidity residing below previous old lows.
Therefore, the market must retrace or consolidate, forming bull flags or bear flags patterns to allow large institutions the opportunity to build on their already profitable positions before the price continues in its direction.
These movements in the price we call “Institutional Order Flow“.
However, one crucial thing to consider is that Bull Flag and Bear Flag Patterns are effective only when they align with the higher-timeframe direction.
What is a Bull Flag Pattern?
The Bull Flag forms during an uptrend and offers one of the cleanest continuation setups. Here’s how to spot it:
Bull Flag Identification Checklist
- Strong bullish flagpole with high volume
- Tight, downward-sloping flag (channel or rectangle).
- Pullback angle less than 45°.
- Volume fades during consolidation.
- Breakout above the flag’s upper trendline on renewed volume.
What is a Bear Flag Pattern?
The Bear Flag is the bearish mirror of its bullish cousin — used to spot short opportunities during downtrends.
Bear Flag Identification Checklist
- Sharp bearish flagpole with strong sell volume.
- Brief upward-sloping flag.
- Pullback angle remains shallow (less than 45°).
- Volume drops during flag formation.
- Breakdown below the flag’s lower trendline with volume spike.
Bull vs Bear Flag: Key Differences | ||||
|---|---|---|---|---|
Pattern | Trend Direction | Flag Slope | Entry Signal | Typical Stop Placement |
Bull Flag | Upward trending market | Downward slope (against trend) | Break above the upper flag trendline with volume | Just below the lower flag trendline or recent swing low |
Bear Flag | Downward-trending market | Upward slope (against trend) | Break below the lower flag trendline with volume | Just above the upper flag trendline or recent swing high |
💡 Pro Trader Tip: Notice how flags always slope against the prevailing trend. This counter-trend consolidation is what creates the “spring-loaded” effect that powers the eventual breakout. |
How to Trade a Bull Flags
Bull flags are powerful continuation patterns, but trading them successfully takes more than just drawing a few lines.
Below, you’ll learn two effective strategies: the classic retail breakout method and the more advanced Smart Money Concepts approach that incorporates liquidity, order blocks, and institutional order flow.

Bull Flag Setup
Before you dive into any flag trade, zoom out and ask yourself: Does this flag make sense within the broader market context?
High-probability bull flags don’t appear randomly — they’re usually part of a well-structured continuation in a trending environment.
1. Multi-Timeframe Confirmation
Flags on the 5-minute chart are noise unless the 1H or 4H chart shows a clear trend. Always start by confirming a bullish structure on the higher timeframes:
- Is the price above key moving averages or structure levels?
- Did the market just break out of a large consolidation or resistance zone?
- Are institutional traders likely to build long positions?
2. The Flagpole: Was the Move Legit?
The flag is only as strong as the pole that precedes it. Look for an impulsive move driven by volume — ideally a breakout from a key level. No pole? No flag.
A flagpole should look like a “sprint,” not a slow jog. Momentum matters.
3. The Flag: Controlled Pause, Not Random Chop
You want a tight, downward-sloping consolidation, not a chaotic pullback. Evaluate:
- Small-bodied candles and overlapping structure?
- Volume fading vs the pole?
- Clean trendlines respected?
If the flag is messy, wide, or lingers too long, it might be a reversal setup in disguise.
4. Liquidity Zones and Institutional Intent
SMC teaches us that institutions pause trends not to take profit, but to load more positions. Watch for equal lows inside the flag — these create liquidity pools that smart money may sweep before sending the price higher.
💡Pro Trader Tip: The best flags feel “obvious in hindsight.” If you have to convince yourself it’s a flag… it probably isn’t. |
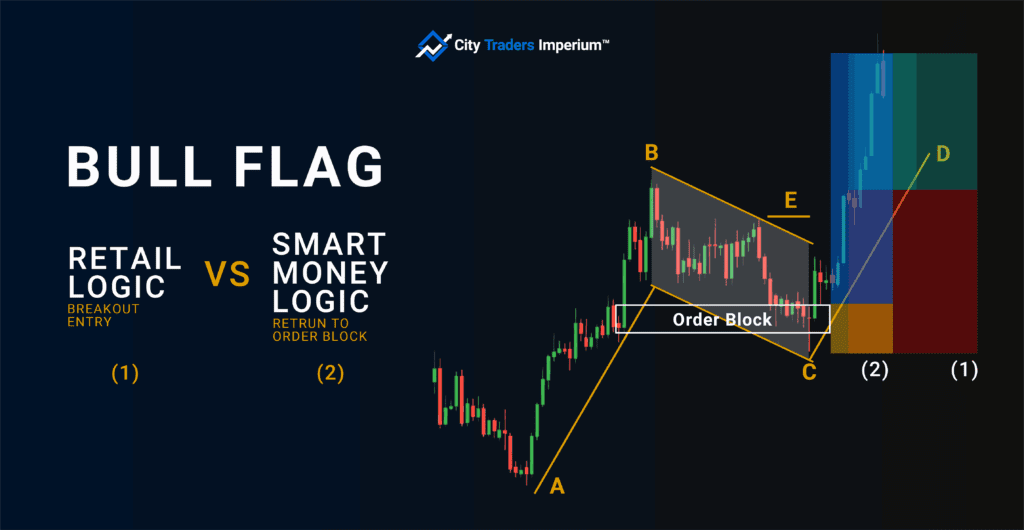
Strategy 1: Classic Breakout Entry (Retail Logic)
This is the most common approach taught in textbooks and used by many retail traders.
Entry Rules
- Enter on a break above the upper flag trendline.
- Confirm the breakout with a volume surge.
- Prefer a candle close over a wick for confirmation.
Stop-Loss Placement:
- Just below the lowest point of the flag.
- Optional: widen slightly to avoid premature stop-outs.
Target:
- Measure the flagpole height.
- Project that from the breakout point.
- Consider partial profit at 1:1, and let the rest ride to 2:1+.
Strategy 2: Smart Money Concepts (SMC) Entry
This method takes into account institutional activity, liquidity zones, and better timing. It’s more advanced but offers tighter entries and higher reward potential.
Entry Logic:
- Wait for a liquidity sweep below equal lows inside the flag
- Look for a Bullish Order Block or Fair Value Gap after the sweep
- Enter on confirmation (e.g., bullish engulfing candle, BOS)
Stop-Loss Placement:
- Just below the Order Block or recent swing low.
- This placement allows tighter risk without guessing.
Target:
- Same target as the breakout method: project flagpole height
- But due to tighter stops, expect R:R of 3:1 or higher
💡 Pro Tip: Smart money enters after the fake move. If you’re patient and understand liquidity, you can follow their lead and not get caught by it. |
Risk Management & Tools
Whether you prefer the classic or SMC approach, risk control is non-negotiable.
- Use our Position Size Calculator to size your trade
- Keep risk per trade under 2%
- Record entries, outcomes, and chart context in your journal
- Test both approaches in a Free-Trial Demo Account before going live
How to Trade a Bear Flags
Bear flags like bull flags can be traded using either the classic breakout method or a more precise Smart Money Concepts (SMC) strategy that accounts for liquidity and institutional behaviour.
Bear Flag Setup
Before trading any bear flag, it’s essential to zoom out and read the story behind the structure. A proper bear flag isn’t just a random pullback — it’s a temporary pause in a larger downtrend, often engineered by institutions to trap late buyers and reload short positions.
Here’s how to assess the setup:
1. Higher Timeframe Confirmation
Check the 1H, 4H, or daily chart to make sure the market is in a confirmed downtrend:
- Lower highs and lower lows.
- Recent break of major support levels.
- Price respecting downward trendlines or EMAs.
- Institutional net short bias (if using SMC).
The smaller the flag, the more it should align with a larger bearish move.
2. The Flagpole: Controlled Panic
You want to see a sharp, impulsive drop that clears the previous structure. Think of the pole as a “panic flush” that creates fear and clears out liquidity. This should happen on high volume and strong bearish candles.
If the move down was choppy, slow, or of low volume, skip it. Weak flags follow weak poles.
3. The Flag: Sloppy Rally ≠ Smart Rally
Look for a tight upward-sloping channel that retraces less than 50% of the pole. The rally should feel tired, hesitant, or overly clean — these are signs of liquidity building, not bullish strength.
Ideal conditions:
- Rising wedge or tight channel structure
- Weak, overlapping candles with wicks
- Volume fading during the bounce
- No clean break of previous swing highs
4. Liquidity Pools and Distribution
From an SMC perspective, this bounce isn’t bullish — it’s distribution. Institutions may be redistributing short positions by drawing in buyers above minor resistance levels.
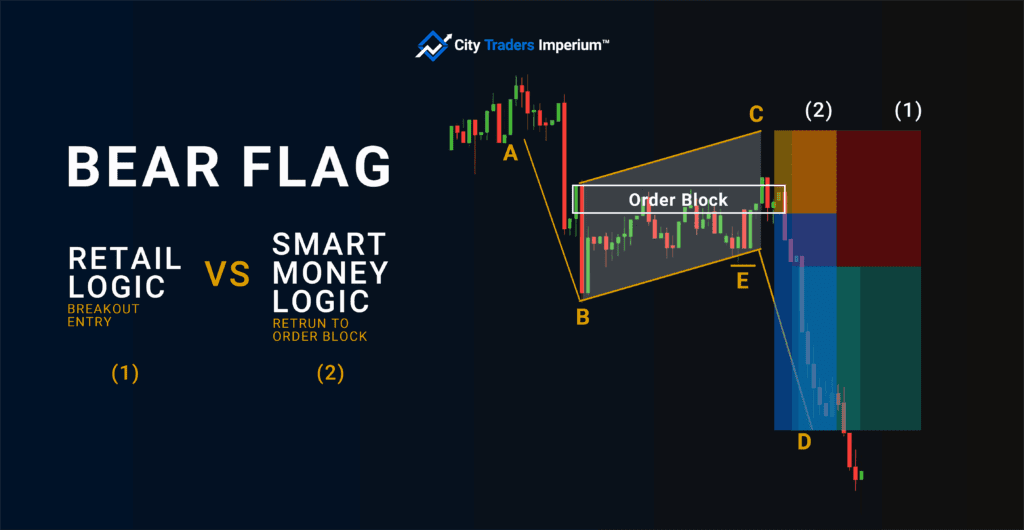
Strategy 1: Classic Breakdown Entry (Retail Logic)
This method is common among retail traders — entering on breakdown through structure, anticipating a continuation of lower.
Entry Rules:
- Enter on a break below the lower trendline of the flag.
- Confirm the breakdown with a strong bearish candle or volume spike.
- Avoid entering during the Asian session or periods of low volatility.
Stop-Loss Placement:
- Above the highest point of the flag (last minor swing high).
- Or slightly above the upper flag trendline to allow breathing room.
Target:
- Measure the height of the flagpole.
- Project downward from the breakout point.
- Secure partial profits near previous lows or key demand zones.
Strategy 2: Smart Money Concepts (SMC) Entry
This advanced approach lets you enter early, often before the flag breaks, but only after institutions have triggered retail stop-losses and collected liquidity.
Entry Logic:
- Identify equal highs or swing highs within the flag.
- Wait for price to sweep those highs (liquidity run).
- Enter short at a Bearish Order Block or Fair Value Gap after the sweep.
- Look for a break of structure (BOS) as confirmation.
Stop-Loss Placement:
- Just above the liquidity sweep or order block.
- Often much tighter than a retail flag breakout entry.
Target:
- Same method: flagpole height projected down.
- Higher R:R potential (3:1 or more) due to early entry.
💡 Pro Trader Tip: If the market spikes up into a resistance zone and immediately sells off, that’s often smart money triggering final retail buys before dumping. |
Success Rates & Back-Test Data
How reliable are bull and bear flag patterns? Traders love them because they’re easy to spot, but it’s essential to understand what the numbers indicate.
According to Thomas Bulkowski’s Encyclopedia of Chart Patterns, bull and bear flags are two of the most statistically reliable continuation patterns:
Bull Flags: ~67% success rate when targeting 3:1 reward-to-risk trades
Bear Flags: ~65% success rate under similar conditions
These statistics were compiled across thousands of historical chart patterns, using strict criteria that included breakout confirmation and stop placement just beyond the flag structure.
It’s worth noting that performance varies across market types (e.g., forex vs. stocks) and timeframes (5M vs. 4H).
Source: Thomas Bulkowski, ThePatternSite.com
Common Flag Patterns Trading Mistakes
Even experienced traders fall into these five traps when trading flag patterns. Avoiding these mistakes can dramatically improve your success rate.
Entering Before the Breakout
The most costly mistake is jumping in during flag formation, hoping to catch the move early. Flag patterns are continuation signals, not entry points themselves. Wait for confirmed breakouts with momentum before entering positions.
Ignoring Volume Confirmation
Volume tells the real story in flag trading. Entering breakouts without volume surges leads to false signals and quick reversals. Always require at least 50% above average volume on your breakout candle.
Using Stops That Are Too Tight
Placing stops just a few pips outside the flag boundaries invites stop hunting by smart money. Give your trades room to breathe by using wider stops based on significant swing levels rather than pattern boundaries.
Chasing Extended Flags
Flags that take longer than three weeks to form lose their predictive power. The longer the consolidation, the weaker the pattern becomes. For optimal results, stick to flags that develop within 5-15 trading days.
Placing Stops at Obvious Liquidity Zones
Retail traders often set stops just below the last flag low or beneath swing lows. These are common targets for institutional sweeps. Know where your stop sits in the bigger picture.
Bull Flag vs Bear Flag Targets – Checklist
- Determine where we are in the price move or trend.
- Are we at a major key level where we would expect a reversal? Or will the price continue to reach a key level?
- Do we still have enough room for the price to reach the final target?
Bear Flag vs Bull Flag FAQs
What is a bull flag pattern?
Answer: A strong upward move (flag-pole) followed by a short, downward-sloping consolidation that often precedes another rally.
What is a bear flag pattern?
Answer: The mirror image — a sharp drop, a brief upward-sloping pause, then a move lower once the flag breaks.
How reliable are flag patterns?
Answer: Studies show ~67 % success for bull flags and ~65 % for bear flags over 3-to-1 reward-to-risk trades, but results vary by market and timeframe.
Where should I place stop-loss and profit targets?
Answer: Common practice is to place a stop loss just outside the opposite side of the flag and a target sized equal to the flag pole’s height projected from the breakout.
Do volume and time length matter?
Answer: Yes — look for rising volume on the pole, declining volume inside the flag, and a breakout occurring within two weeks for higher probability.
Conclusion
Bull and bear flags remain two of the most reliable continuation patterns when traded with the right timing, context, and risk control. Whether you follow classic breakouts or Smart Money entries, understanding the market’s intent is key.
Flag Patterns viewed in isolation don’t give us any indication of what the price is going to do and whether the trade setup is a high probability or not. This explains why most retail traders fail to trade this pattern profitably, despite its popularity.
Understanding what institutions are doing and the logic behind why the market is in consolidation or should move in a certain direction will increase your chances of success and help you avoid getting stopped out prematurely.