


The Daily Bias – The Missing Piece in Most Traders’ Analysis
So you’ve been struggling with inconsistency, constantly getting caught in drawdowns, or feeling lost in the noise of lower timeframes. In that case, chances are you’re overlooking one critical aspect of trading: understanding the Daily Bias. At City Traders Imperium, traders are taught to build that context first, so every intraday decision is made with a clearer directional framework.
Most traders are taught to focus on the higher timeframe trend but fail to recognize that the market does not move in a straight line. It ebbs and flows within the daily candle, and in that movement – rather than the final close of the candle – is where the opportunity lies for intraday traders.
This guide will teach you how to develop an effective method for determining the Daily Bias using ICT concepts.
Key Findings
- Daily Bias pinpoints where price is likely to raid liquidity inside today’s candle—not how that candle will close—giving intraday trades a clear directional script.
- Build the bias top-down: confirm daily/4 h order flow, map the current dealing range, tag external liquidity (last 3-day highs/lows, equal highs/lows), and note order blocks or fair-value gaps that price is drawn to.
- Asian-session sweeps often set the trap; a grab of the Asian low followed by a sharp reversal flags a bullish day, while a sweep of the Asian high tips a bearish agenda.
- Execute on 5 m–1 h charts: wait for a market-structure shift plus a 62–79 % OTE pullback into a POI, place stops beyond the liquidity wick or block, and target the next major pool.
- Trading with a defined Daily Bias curbs overtrading, aligns entries with smart-money flows, and hard-wires realistic stop-loss and profit targets for steadier results.
What is Daily Bias, and Why Does It Matter?
Daily bias is the anticipated directional movement of the market within a single trading day. It is not about predicting whether the daily candle will close bullish or bearish – this is a common misunderstanding that leads many traders astray.
Instead, it is about identifying where the market is likely to reach for liquidity and how manipulation will occur on price before delivering a significant move.
A well-defined Daily Bias gives you a clearer structure for execution, risk, and trade selection. For traders who want to practise this kind of decision-making in live market conditions before committing to a full evaluation, CTI also offers a free trial prop firm experience.
- A directional guide to focus on high-probability trades.
- A “Framework” to avoid counter-trend trades that often lead to unnecessary losses.
- More precise trade execution by aligning entries with Smart Money Price Action.
- Enhanced risk management by setting realistic stop-loss and profit targets.
Without Daily Bias, traders fall into the cycle of overtrading, chasing reversals, or getting stopped out by the inevitable liquidity hunts.
How to Determine Daily Bias Using ICT Concepts
ICT trading principles focus on how price seeks liquidity, rebalances inefficiencies, and respects institutional order flow. Here’s a structured approach to determining Daily Bias:
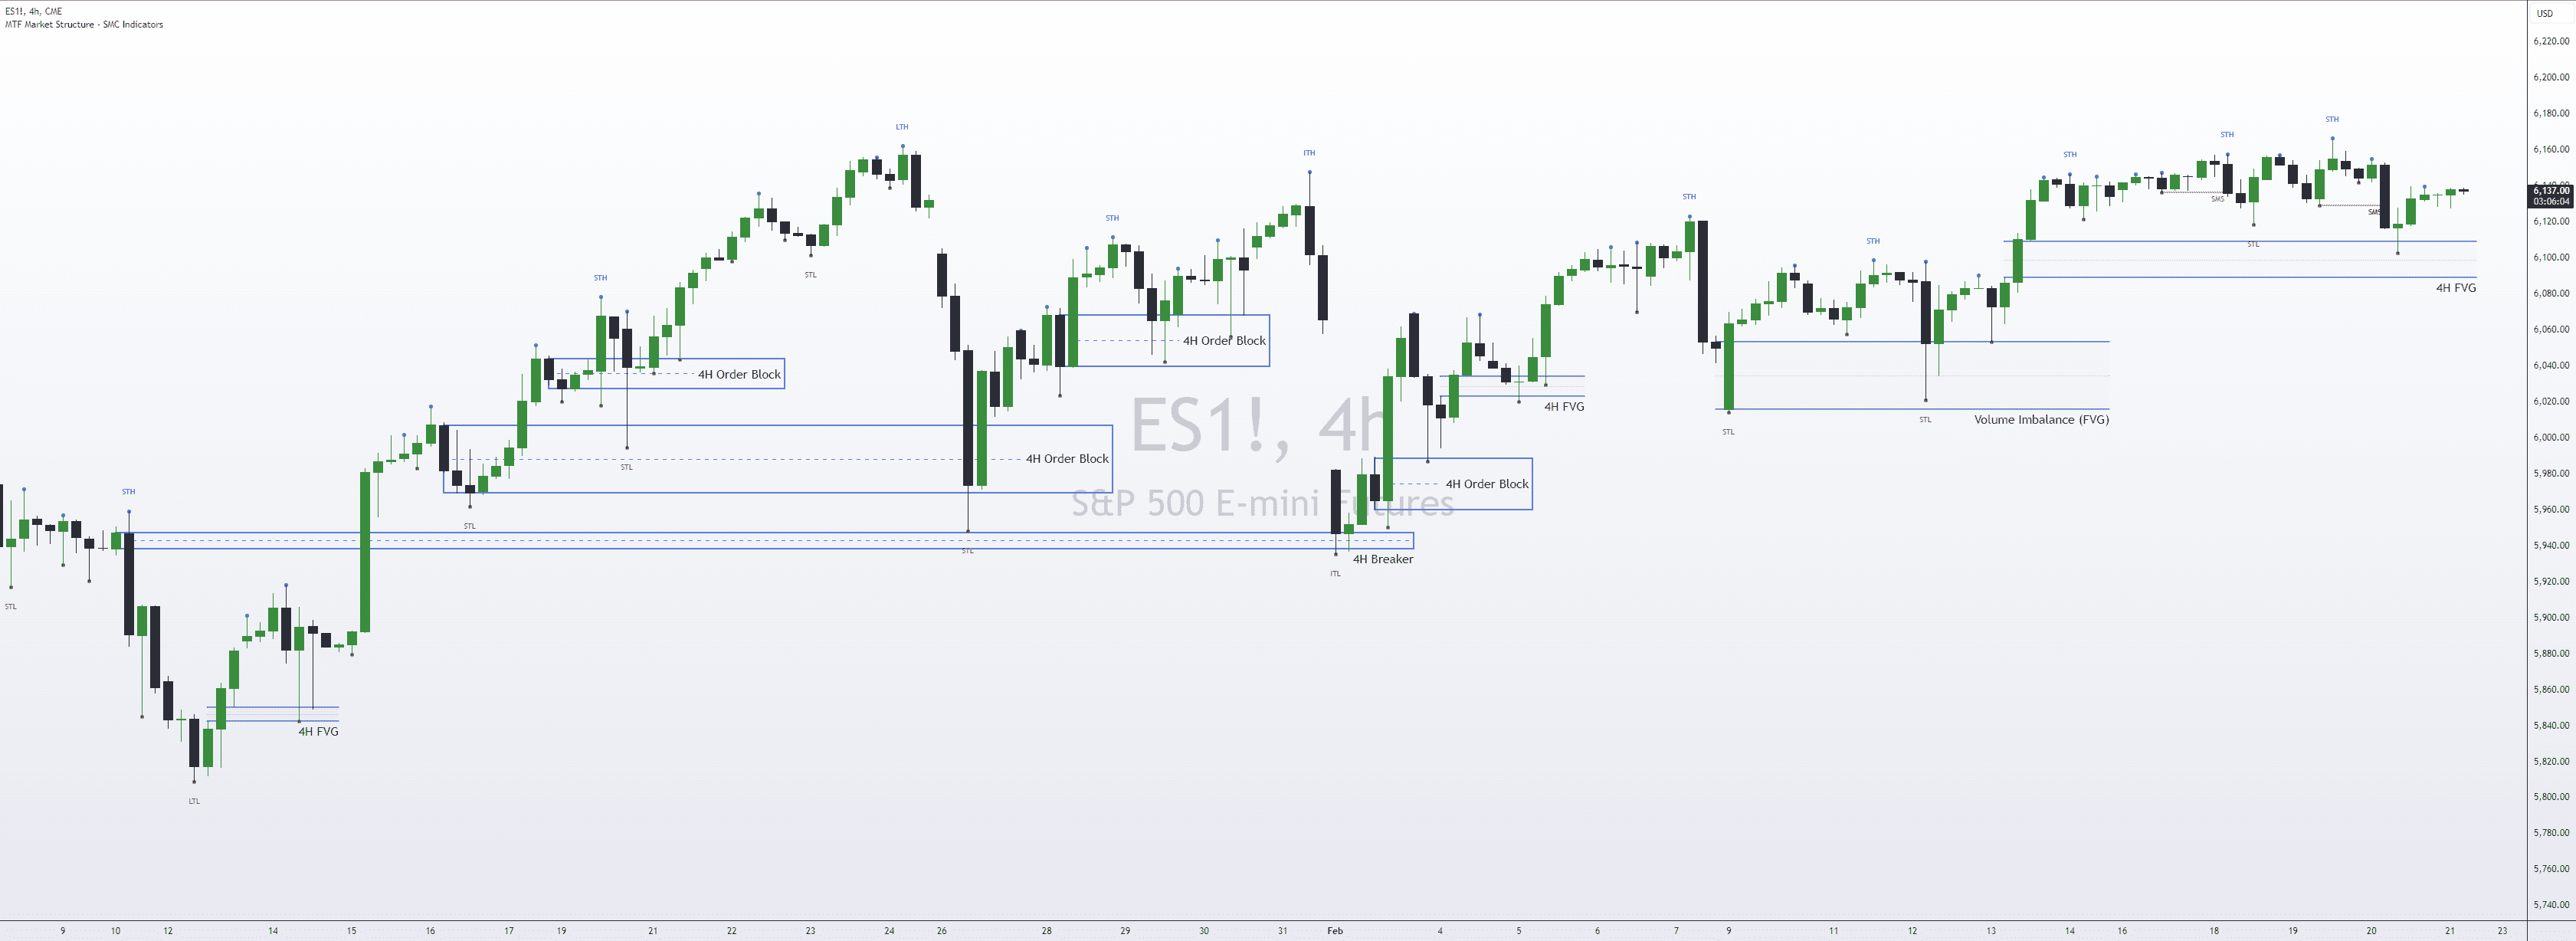
1. Analyse the Daily and 4H Order Flow
Order flow is the backbone of market direction. Ask yourself:
- Bullish Bias: Are Order Blocks and FVGs supporting prices moving higher?
- Bearish Bias: Are Order Blocks and FVGs supporting prices moving lower?
- Neutral: Is the price consolidating within a range? Consider Liquidity on both sides.
2. Identify the Current Dealing Range & Liquidity Pools
The market is always hunting for External Range Liquidity. Before the price moves significantly in one direction, it often sweeps previous highs or lows to trigger stop-losses and fuel the real move. Look for:
- Dealing Ranges: the price will tend to move from one liquidity pool to the next. Identify the current dealing ranges from the daily down to the 15-minute timeframe. Once the price runs the liquidity on one side of the dealing range and reverses, expect it to run the other side of the dealing range.
Below is an example of a Dealing Range plotted on the 1H chart.

If You’re looking for an indicator to help you find key highs and lows and market structure like in the chart above,
then visit the Smart Money Concepts Indicators Website.
- Last 3 days highs & lows: High-probability liquidity pools for entries and targets.
- Equal highs/lows – Prime spots for liquidity grabs before trend continuation or reversal.

3. Recognize Institutional Order Blocks & Fair Value Gaps (FVGs)
Smart Money leaves footprints where you can anticipate reactions at key price levels:
- Bullish Order Block: A previous bearish candle before a sharp move higher.
- Bearish Order Block: A previous bullish candle before a sharp move lower.
- Fair Value Gaps (FVGs) – Areas of imbalance where the price is likely to return before continuing.
4. Observe the Asian Session Range for Manipulation
ICT’s Power of Three concept states that price moves in three phases: Accumulation, Manipulation, and Distribution. Often, the Asian session acts as the accumulation phase before a liquidity grab in London and the real move in New York.
- If the price sweeps the Asian low and then aggressively moves higher – Expect a bullish day.
- If the price sweeps the Asian high and then aggressively moves lower – Expect a bearish day.

5. Consider the Macro Environment & Economic Calendar
Although ICT’s methodology is primarily technical, understanding the broader market context, such as High-Impact News Events, provides an understanding of when liquidity sweeps are highly likely to occur.
For example, if there is a major key level, such as a Previous Daily Low that the price is hovering above, having a high-impact news event at 8:30 NY Time on Thursday might be an indication to wait until the news event to sweep the Daily low, and then wait for a reveal entry.

Implementing Daily Bias into Your Trading Strategy
Once you have determined the Daily Bias, your next step is to execute trades in alignment with it. This is where process and consistency matter most, especially if your goal is to pass a funded account challenge and prove that you can apply a repeatable edge under clear rules.
1. Identify Key Points of Interest (POIs)
Before executing a trade, mark out significant areas where the price is likely to react:
- Liquidity Levels (previous highs/lows, equal highs/lows, swing points).
- Order blocks & fair value gaps (areas where price may return before continuation).
- Session highs/lows (London session often sets the directional tone).
2. Drop to a Lower Timeframe for Entry Confirmation
While the daily chart provides the bias, execution should be done on the 5M, 15M, or 1H timeframes:
- Look for Market Structure Shifts (break in swing highs/lows) that align with Daily Bias.
- Use Optimal Trade Entries (OTE) based on Fibonacci retracements (preferably 62%-79% pullbacks).
- Before entering a trade, wait for confirmation (e.g., rejection wicks and engulfing candles).
3. Set Realistic Stop-Loss & Profit Targets
Risk management should be built around the Daily Bias:
- Stop-loss – Below/above the POI you’re using for entry (e.g., under an order block or liquidity grab wick)
- Take-profit – At the next major liquidity pool or imbalance zone
Example: If the Daily Bias is bullish, and the price sweeps the previous daily low before rejecting from a bullish order block – Look for long entries targeting the previous daily high.
Real-World Example: Applying Daily Bias
Let’s say you analyze the daily chart and determine:
- Order flow is bullish.
- The previous daily low aligns with a fair value gap and an order block.
- Liquidity is resting at the previous daily high.
In the lower timeframe, the price sweeps the previous day’s low during the London session and aggressively reverses. This confirms your bullish bias. A high-probability long entry would be at the FVG or order block, with a target at the previous daily high.
By applying this structured approach, you trade in alignment with smart money rather than against it.
Final Thoughts: Master Daily Bias, Master the Market
Most traders fail because they trade without context. They chase entries without understanding why the market is moving. Mastering Daily Bias eliminates uncertainty, aligns with institutional flows, and significantly improves your consistency.
Focus on:
- Identifying liquidity pools and order flow on the daily chart
- Tracking how price manipulates liquidity before making its real move
- Using ICT’s key concepts – order blocks, fair value gaps, and optimal trade entries
- Executing trades on lower timeframes with high-probability setups
This is how professional traders approach the market. By adopting this methodology, you shift from guessing price movements to precisely anticipating them.
Master Daily Bias and the rest of your trading strategy will fall into place.