

Unlock the Secret to Spotting Major Market Shifts Before They Happen
Trading is all about timing. Get in too early, and you might watch your capital dwindle as you wait for the market to catch up. Enter too late, and you’ve missed the boat. That’s where the Head and Shoulders pattern comes in.
It can tip you off to big market changes before they happen. Traders who know how to spot and use a head and shoulder formation often have a leg up on the competition.
What if you could see this pattern forming before everyone else? Imagine being able to set up your trades while others are still trying to figure out what’s going on.
In this comprehensive guide, we’ll cover:
- Why this pattern is so important across various markets, including stocks, forex, and commodities;
- The anatomy of both standard (bearish) and inverse (bullish) Head and Shoulders patterns;
- Step-by-step formation process: from identifying the trend to validating the neckline.
- Techniques to spot the pattern early, giving you a trading edge;
- How to use volume analysis to confirm the pattern’s strength;
- Practical risk management strategies, including stop-loss placement and position sizing;
- Common pitfalls to avoid, such as misidentifying patterns or ignoring market context.
Historical Context of the Head and Shoulders Pattern
The Head and Shoulders pattern has a rich history in technical analysis, dating back to the early 20th century. It was first popularized by technical analyst Richard W. Schabacker in his 1930 book “Stock Market Theory and Practice.” Schabacker, often considered the father of technical analysis, described the pattern as one of the most reliable trend reversal indicators.
In the 1940s, Edwards and Magee further developed and refined the concept in their seminal work “Technical Analysis of Stock Trends.” This book, which is still regarded as a cornerstone text in technical analysis, provided detailed explanations and illustrations of the Head and Shoulders pattern, cementing its place in the toolkit of traders and analysts.
Over the decades, the pattern has been subjected to numerous statistical studies and backtests. Notable among these is the 1991 study by Head and Shoulders proponent William Brock, which found the pattern to have significant predictive power in forex markets.
Importance in Trading
The Head and Shoulders pattern holds importance in various financial markets for several reasons:
- Versatility across markets:
- Stocks: Widely used in equity markets to identify potential trend reversals in individual stocks and indices.
- Forex: Particularly popular in currency trading due to its ability to capture sentiment shifts in highly liquid markets.
- Commodities: Effective in identifying trend changes in commodities like gold, oil, and agricultural products.
- Psychological insight: The pattern reflects the psychology of market participants, capturing the transition from bullish to bearish sentiment (or vice versa in the inverse pattern). This makes it a valuable tool for understanding market dynamics.
- Clear entry and exit points: The well-defined structure of the head and shoulders formation provides traders with specific levels for entering trades and setting stop-loss orders, aiding in risk management.
- Potential for significant moves: When correctly identified, the Head and Shoulders pattern often precedes substantial price movements, offering traders the opportunity for profitable trades.
- Integration with other analysis: The pattern complements other forms of technical and fundamental analysis, allowing traders to confirm signals and increase confidence in their trading decisions.
- Time frame flexibility: The Head and Shoulders pattern can be observed across various time frames, from intraday charts to weekly and monthly views, making it adaptable to different trading styles.
- Educational value: For novice traders, the Head and Shoulders pattern serves as an excellent introduction to pattern recognition and the concept of trend reversal, forming a foundation for more advanced technical analysis.
Understanding the Head and Shoulders Pattern
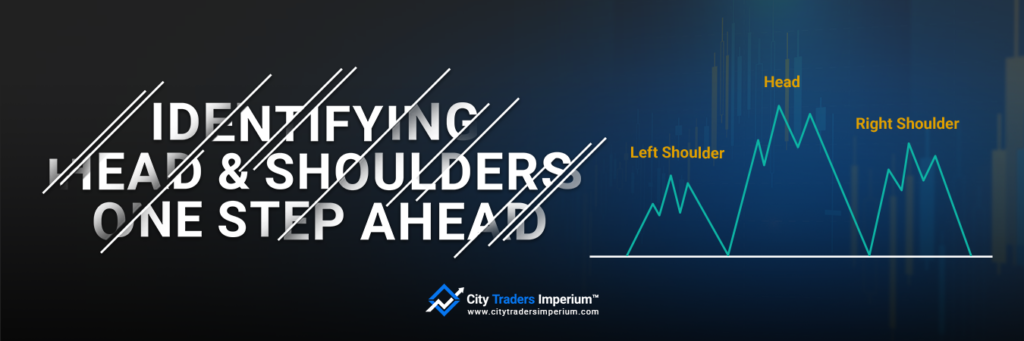
The Head and Shoulders pattern is a reversal pattern that typically forms after an uptrend and signals a potential trend reversal to the downside. The pattern consists of three peaks: a higher peak (the head) between two lower peaks (the shoulders). The key components of the pattern include the left shoulder, head, right shoulder, and a neckline connecting the lows of the two troughs formed between the shoulders and the head.
Types of Head and Shoulders Patterns
- Standard Head and Shoulders (Bearish)
- Forms after an uptrend
- Signals a potential reversal from bullish to bearish
- Inverse Head and Shoulders (Bullish)
- Forms after a downtrend
- Signals a potential reversal from bearish to bullish
Both types follow similar formation principles but in opposite directions.
Downtrend Confirmation
- The Head and Shoulders pattern usually emerges after a sustained uptrend. The first step in identifying the pattern is to confirm the existence of a prior uptrend.
- Look for a series of higher highs and higher lows on the price chart, indicating the prevailing bullish trend.
Formation of Left Shoulder
- The left shoulder is the initial lower peak formed after the uptrend. Traders should pay attention to the formation of this peak.
- Observe for signs of hesitation or a slowdown in upward momentum, suggesting a potential change in trend direction.
Formation of Head
- As the price continues to rise after the left shoulder, the head is formed as the highest peak in the pattern.
- Watch for signs of overextension or exhaustion in the upward movement. Increased volatility or a decrease in buying interest may be indicative of a potential reversal.
Formation of Right Shoulder
- The right shoulder completes the pattern, forming another lower peak after the head.
- Similar to the left shoulder, look for signs of weakening bullish momentum. A failure to surpass the height of the head can be a significant signal.
Neckline Validation
- The neckline is a horizontal line connecting the lows of the troughs between the shoulders and the head.
- Validate the neckline as a critical support level. A breach of this support confirms the completion of the pattern and suggests a potential downtrend.
Volume Analysis
- Observe the volume during the formation of each peak. Typically, the volume decreases from the left shoulder to the head and increases from the head to the right shoulder.
- A significant spike in volume during the breakdown of the neckline further validates the pattern.
Identifying the Pattern One Step Before Completion
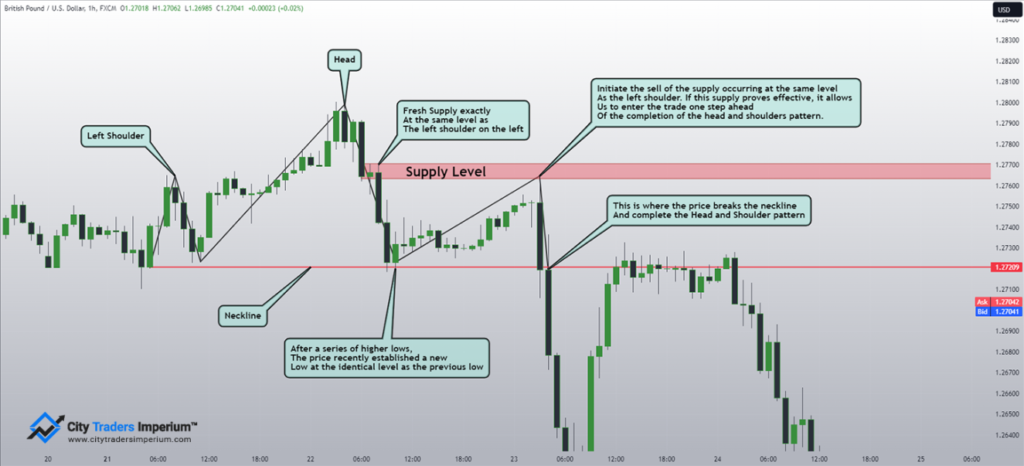
The head and shoulders pattern serves as a reversal signal, suggesting that the ongoing momentum is likely coming to an end. The underlying concept is straightforward: suppose the price is in a bullish trend, forming higher lows. To shape the head, the price must significantly decline to the same level as the last low, indicating a potential weakening of buyer strength or an increase in seller dominance.
As traders, we can envision the head and shoulders pattern taking shape. The next step involves monitoring the price movement. If the price begins to rise from the same level as the last low, we should scrutinize the situation for a possible entry point. If there’s a discernible supply or other compelling reasons, we may consider entering a sell position precisely at the level of the left shoulder. This is typically where the price is expected to turn downward if the pattern completes.
By correctly anticipating this movement, we enter the trade just before the entire pattern is confirmed. This approach eliminates the need to wait for the price to break the neckline, offering a significant advantage with a more favorable risk-reward ratio.
The image below illustrates the formation of a new supply, enabling us to enter a sell position at the peak of the right shoulder, one step ahead of the pattern’s completion and neckline break.
Managing Risk in Head and Shoulders Trading
Stop-Loss Orders
Always use stop-losses when trading Head and Shoulders patterns. For standard patterns, put your stop above the right shoulder. For inverse patterns, place it below. This protects you if the market moves against you.
Trailing Stops
Think about using trailing stops to secure profits as the trend unfolds. Start with a set distance from your entry point and move it as the price goes your way. This lets you ride the trend while keeping your gains safe.
Smart Position Sizing
Don’t risk too much on one trade. Size your position based on the gap between your entry and stop-loss. Aim to risk no more than 1-2% of your trading money on a single trade. For Head and Shoulders trades, you might want to start small and add more if the pattern plays out.
Steering Clear of Common Head and Shoulders Trading Mistakes
Don’t Confuse Consolidation with Patterns
Be careful not to mix up normal price movements with a real Head and Shoulders pattern. Look for clear peaks and valleys that form the shoulders and head. The pattern should show up after a clear uptrend or downtrend.
Look at the Bigger Picture
Don’t forget to check what’s happening in the broader market. A Head and Shoulders pattern might not mean much if it goes against a strong overall trend. Always consider other factors like support and resistance levels.
Don’t Jump the Gun
Patience pays off. Wait for the pattern to fully form before making your move. It’s better to miss a trade than to lose money on one that’s not ready yet.
Putting the Head and Shoulders Pattern to Work
Now that you’ve learned all the essentials about the head-and-shoulders pattern, it’s time to use this knowledge. Spotting this pattern early can give you a real edge in the market.
But knowing the pattern is just the start. To make the most of it, you’ll need to practice identifying it across different timeframes.
Don’t forget to use it alongside other technical indicators. And always keep an eye on the bigger market picture.
Trading isn’t just about spotting patterns – it’s about using them wisely. The Head and Shoulders can be a powerful tool, but it’s how you use it that counts.
Feeling confident about your trading abilities? Why not put them to the test?
City Traders Imperium offers traders like you a chance to prove your skill and secure funding for your trades.
We offer three funding challenges you can choose from: 2-step, 1-step, or no-evaluation challenges.
It’s your chance to prove your trading abilities in real market conditions. Successful traders can receive significant funding to trade with.
Think you’ve got what it takes?