

Introduction
Forex traders often struggle to predict trend reversals. RSI divergence, a specific use of the RSI indicator, can help with this challenge. They’re not perfect, but they can signal potential market shifts before they happen. By the end of this guide, you’ll understand how to use RSI divergence to spot possible trend changes. This knowledge can improve your market analysis and inform your trading choices. Let’s examine RSI divergence in detail.
Key Findings
- RSI divergence arises when price makes a new extreme but RSI does not, foreshadowing potential trend reversal ahead of overbought/oversold signals.
- Two types: bullish divergence shows higher RSI low against lower price low; bearish divergence shows lower RSI high against higher price high.
- Reliability improves when divergence coincides with trendlines, candlestick patterns, supply-demand zones, and confirmation across multiple timeframes.
- Method delivers early reversal cues and defined entry/exit points but may lag, fail in strong trends, or issue false alerts without confirmation.
- Common pitfalls include seeing divergence everywhere, entering before price reacts, ignoring broader trend context, and risking oversized positions.
Navigating the Basics of RSI
Before we dive into the world of RSI divergence, let’s take a moment to refresh our understanding of the Relative Strength Index. RSI, a momentum oscillator, gauges the speed and change of price movements. It fluctuates between zero and 100, highlighting overbought or oversold market conditions. Traditionally, an RSI above 70 signals overbought conditions, while an RSI below 30 indicates oversold conditions.
However, these levels aren’t absolute – during strong trends, the RSI can remain in overbought or oversold territory for extended periods.
Understanding RSI Divergence
RSI divergence occurs when the price of a currency pair moves counter to the RSI indicator. This misalignment can signal a potential weakening of the current trend. RSI divergence comes in two main forms: bullish and bearish.
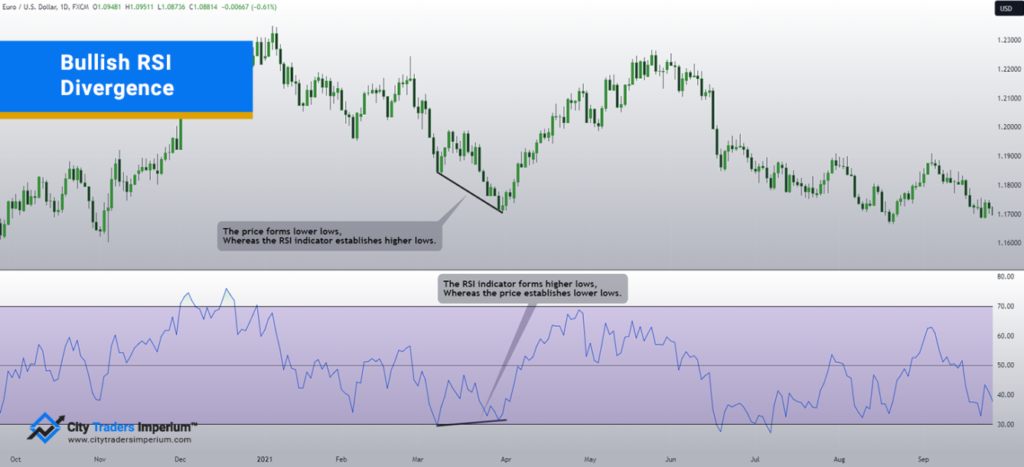
Bullish Divergence
This happens when the price hits a new low, but the RSI doesn’t confirm the low and instead forms a higher low. It hints that though the price is weakening, the momentum behind the decline is slowing down, suggesting a potential bullish reversal.
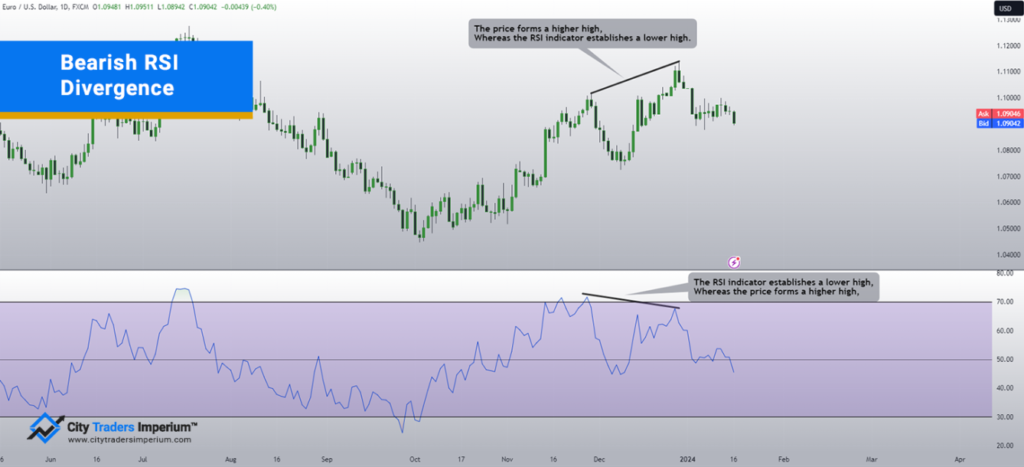
Bearish Divergence
Conversely, bearish divergence occurs when the price achieves a new high, but the RSI fails to confirm the high and forms a lower high. This signals that while the price is reaching new heights, the momentum is waning, indicating a potential bearish reversal.
Pros and Cons of RSI Divergence
| Pros | Cons |
|---|---|
| ✅ Signals potential reversals early. | ❌ Can produce false signals. |
| ✅ Applicable across multiple timeframes. | ❌ Requires practice to identify accurately. |
| ✅ Complements other technical indicators. | ❌ May lag in fast-moving markets. |
| ✅ Identifies overbought and oversold conditions. | ❌ Limited effectiveness in strong trends. |
| ✅ Provides clear entry and exit points. | — |
Spotting RSI Divergence in Action
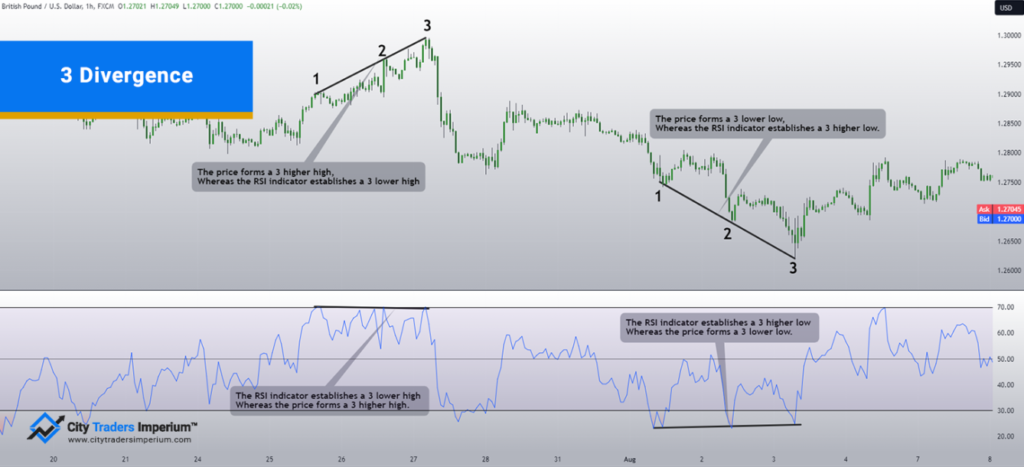
Visualizing RSI divergence is best done with an example. Imagine a scenario where a currency pair’s price is hitting successive higher highs, but the RSI is forming lower highs. This discrepancy signals that the upward momentum is losing steam, potentially paving the way for a bullish reversal. Conversely, if the price is forming lower lows while the RSI is marking higher lows, it could suggest a weakening downward momentum and the possibility of a bullish reversal.
Here is an illustration of three instances of divergence, including both bullish and bearish scenarios.
Incorporating RSI Divergence into Your Strategy
Now that we’ve delved into the intricacies of RSI divergence, let’s delve deeper into how traders can seamlessly incorporate this concept into their Forex trading strategy.
- Confirmation through Price Action: To optimize the effectiveness of RSI divergence, it’s essential to complement it with other technical indicators or price action patterns. Look out for additional signals such as trendlines, candlestick patterns, support/resistance, or supply/demand levels to enhance the reliability of the observed divergence.
- Consider Multiple Timeframes for a Holistic View: To gain a more comprehensive perspective, it’s valuable to analyze RSI divergence across various timeframes. Divergence observed on longer timeframes often holds more significance, potentially indicating more substantial trend reversals. By examining multiple timeframes, traders can refine their understanding of the market dynamics and make well-informed decisions.
- Combine with Other Indicators: Strengthen your analysis by incorporating other technical indicators. Combining RSI divergence with indicators like moving averages or trendlines can provide a more comprehensive view.
- Prioritize Robust Risk Management: Despite its potency, RSI divergence is not infallible. To navigate the inherent uncertainties of the market, it’s crucial to implement robust risk management practices. This includes judiciously setting stop-loss orders and adopting a proactive approach to mitigate potential losses. A sound risk management strategy ensures that the benefits of RSI divergence are maximized while minimizing the impact of unforeseen market fluctuations.
Watch Out for These RSI Divergence Mistakes
- Seeing Divergence Everywhere – Not every RSI movement opposite to price is a true divergence. Look for clear, significant differences between price and RSI movements. If you’re unsure, it’s probably not a strong divergence signal.
- Forgetting the Bigger Picture – A divergence on a 5-minute chart might not mean much if the daily trend is strong in the opposite direction. Always check how your divergence fits into the larger trend.
- Rushing Into Trades – Just because you see a divergence doesn’t mean you should trade immediately. Wait for the price to actually start moving in the direction the divergence suggests before entering a trade.
- Risking Too Much – Don’t bet all your money on a divergence trade. Use the same position size you would for any other trade. Divergences can be wrong, too!
- Expecting Instant Reversals – Sometimes, divergences only lead to a brief pause in the trend, not a full reversal. Don’t assume every divergence will cause the price to completely change direction.
Addressing Key Questions about RSI Divergence
Now, let’s address some common queries that traders often ponder:
What Time Frame is Best for Divergence?
The effectiveness of divergence can vary across different timeframes. While it can be observed on various charts, many traders find it more reliable on higher timeframes, such as the daily or 4-hour charts. Longer timeframes often provide more substantial and dependable signals.
What is the best RSI setting for divergence?
Determining the optimal RSI setting for divergence is a question that often lingers in the minds of traders. The choice of RSI settings can vary based on individual preferences, market conditions, and trading styles. While the default setting of 14 periods is widely used, some traders may experiment with shorter or longer timeframes to tailor RSI to their specific needs. Shorter periods, such as 9 or 10, can offer more sensitive readings, potentially signaling divergence earlier, but may also lead to more false signals. On the other hand, longer periods, like 20 or 25, provide smoother readings, reducing the likelihood of false signals but potentially delaying the detection of divergence.
Determining the optimal RSI setting for divergence also extends to the overbought and oversold conditions, crucial facets of this versatile indicator. While the default RSI levels of 70 for overbought and 30 for oversold are widely accepted, traders often tweak these thresholds to align with their risk tolerance and market dynamics. Some traders may prefer a more conservative approach, setting overbought at 80 and oversold at 20, to filter out potential false signals and wait for more extreme market conditions. Conversely, a more aggressive stance might involve using 75 for overbought and 25 for oversold, capturing a broader range of price movements. Ultimately, finding the best RSI setting for divergence involves a delicate balance between the chosen period, overbought, and oversold levels, all tailored to the trader’s unique preferences and the specific nuances of the currency pair in focus.
Does RSI Divergence Always Work?
As with any trading tool, RSI divergence is not foolproof. It’s a valuable indicator, but market conditions can be unpredictable. Traders should view divergence as a supportive tool rather than an absolute guarantee. It’s essential to consider other factors and use divergence in conjunction with a broader trading strategy.
Is RSI or MACD Better for Divergence?
Both RSI and MACD (Moving Average Convergence Divergence) can be effective for identifying divergence. However, the choice between the two often boils down to personal preference and trading style. Some traders prefer RSI for its simplicity, while others favor MACD for its ability to capture both trend and momentum. It’s advisable to experiment with both and see which resonates better with your trading approach.
Helpful Tools for Spotting RSI Divergence
While many traders identify RSI divergence manually, several tools can make this process easier and more efficient. Here are some popular options:
- TradingView
- Free and paid versions are available
- Offers customizable RSI indicators and divergence detection tools
- Users can create alerts for potential divergences
- MetaTrader 4 and 5
- Widely used trading platforms with built-in RSI indicators
- Many free custom indicators available for download that can automatically detect RSI divergence
- eSignal
- Professional-grade charting software with advanced RSI divergence detection
- Offers real-time alerts and customizable scans
- Ninja Trader
- Popular among futures traders but also supports forex
- Offers customizable RSI indicators and the ability to create automated divergence detection strategies
While these tools can be helpful, it’s important to understand the concept of RSI divergence thoroughly before relying on automated detection. No RSI divergence indicator tool is perfect, and your own analysis and judgment should come first when interpreting divergence signals.
Conclusion
RSI divergence stands as a valuable ally in the Forex trading arena, offering traders insights into potential trend reversals. By understanding its nuances and integrating it into a well-rounded strategy, traders can leverage RSI divergence to navigate the ever-changing currents of the currency markets. Remember, there’s no one-size-fits-all solution in trading, so continuous practice and adaptation are key to mastering this powerful tool.
Ready to turn your RSI divergence knowledge into real trading success? Visit our website to learn more about our Funded Trader Program and take the first step towards your professional trading career with City Traders Imperium.