

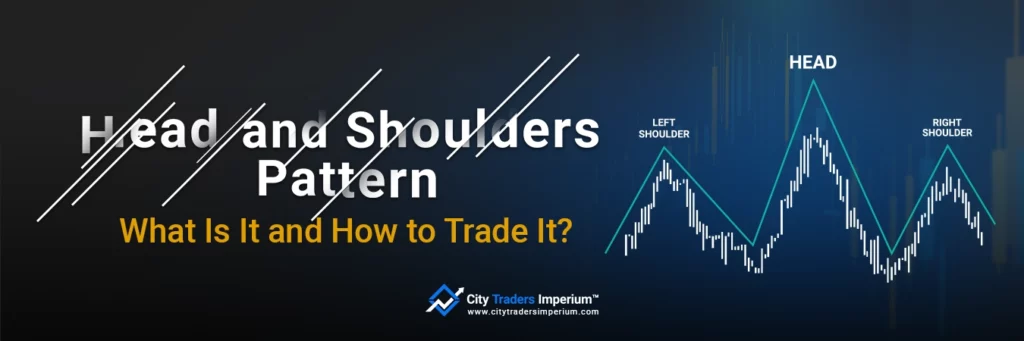
Head and Shoulders Pattern: What Is It and How to Trade It
‘Head and shoulders’ is usually associated with either dandruff or knees and toes (repeated twice). But did you know that it also plays a vital role in trading?
Indeed, as one of the most popular and reliable trend reversal patterns, the head and shoulders chart pattern helps traders predict a bullish-to-bearish trend reversal and determine that an upward trend is nearing its end.
Given the valuable insights it provides, it’s no surprise that many traders use the head and shoulders pattern as one of their primary trading patterns.
But what exactly is the head and shoulders chart pattern? What are its strengths and weaknesses? And, most importantly, how to use it when trading?
Let’s dive in (headfirst).
Key Findings
- A confirmed break of the neckline after the right shoulder signals a high-probability reversal from bullish to bearish (or bearish to bullish in the inverse pattern).
- Use the neckline for precision: enter on the close beyond it and park the stop-loss just above (or below for the inverse) to cap downside.
- Set the profit target by measuring the head-to-neckline height and projecting that distance from the breakout point.
- Works across forex, equities, and crypto, letting traders map clear entries, exits, and risk, though wide confirmation candles can force larger stops on higher time-frames.
- Waiting for a close and, when possible, a retest of the neckline filters out false breaks that often trip up less-experienced traders.
What Is the Head and Shoulders Pattern?
The head and shoulders pattern is one of the most reliable trend reversal patterns. Furthermore, it’s incredibly easy to spot.
The pattern is formed by three peaks – two shoulders and a head. First comes one shoulder (1st peak), followed by a higher peak (head) and another lower peak (2nd shoulder), with the line called ‘neckline’ connecting the two lowest points.
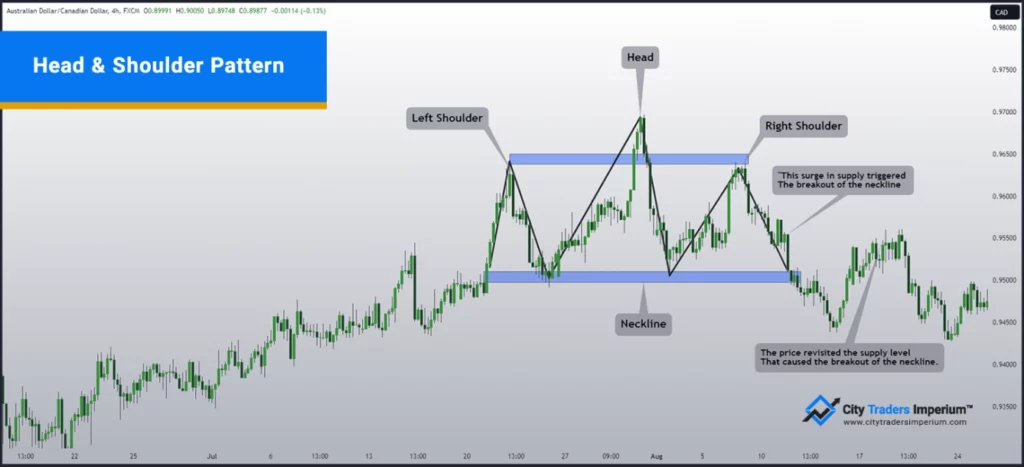
Here’s what it tells the trader:
- Left shoulder – the price rose, reached its peak, and started to decline.
- Head – the price rose again until it reached a higher peak and started to decline again.
- Right shoulder – after another decline, the price began to rise, forming the right peak lower than the head.
Inverse Head and Shoulders Chart
The traditional head and shoulders pattern is a bearish reversal pattern. In other words, it signals the peak of the uptrend and the start of the reversal.
The inverse head and shoulders pattern, on the other hand, is a bullish reversal pattern, signalling the end of a downtrend. What does it look like? As implied by its name, it’s an upside-down head and shoulders pattern.
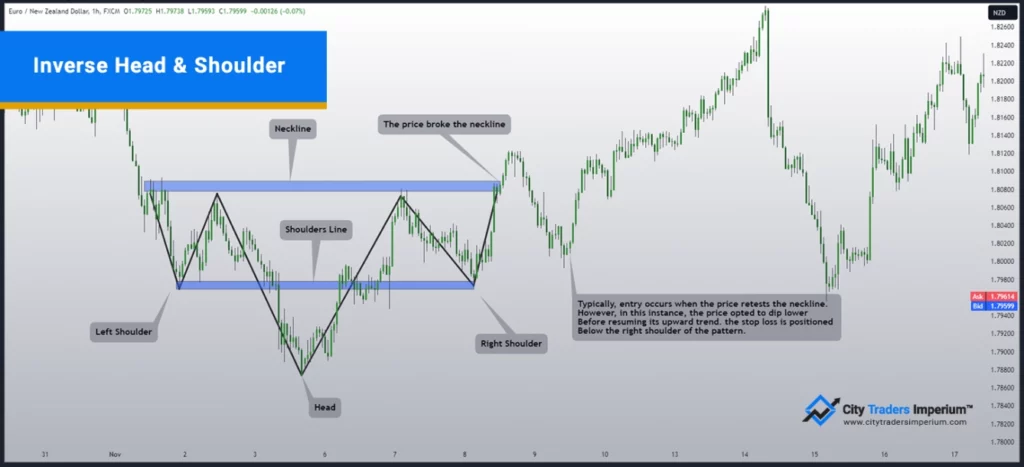
Instead of three peaks, we have three valleys representing two shoulders and a head:
- Left shoulder – the price declines, hits the bottom and starts to increase.
- Head – The price starts to decline again, forms an even lower valley and begins to rise.
- Right shoulder – The price begins to decrease, forming the right bottom higher than the head.
How to Trade the Head and Shoulders Pattern?
Noticing the head and shoulders pattern forming is one thing. Another is using it to your advantage. When it comes to that, the neckline plays the first violin.
There are three reasons for that:
- One, the pattern is activated once the neckline is broken. Before that happens, the pattern is considered to be incomplete.
- Two, a neckline determines the stop-loss. For instance, any reverse price move to the other side of the neckline activates the stop-loss, immediately invalidating the pattern.
- And three, the profit is calculated by measuring the distance between the head and the neckline.
Let’s take a look at how the traditional head and shoulders pattern is usually traded, step by step:
- Wait for the pattern to complete – wait for the price action to move below the neckline after the peak of the right shoulder (or above the neckline of the right valley when trading the inverse pattern).
- Initiate the trade – there are two common entry points:
- The neckline is broken – you enter a short trade immediately after the breakout, and the candle closes below the broken neckline.
- After the breakout – an option preferred by most traders; you enter a trade after the price action closes below the neckline, confirming the breakdown.
- Stop Loss – where you place your stop will depend on your entry point:
- If you entered the trade immediately after the breakdown, the stop is placed just above the right shoulder (or below when trading the inverse pattern).
- If you entered the trade after the breakout, wait for the pullback (if it occurs).
- Take Your Profit – in the head and shoulders pattern, the profit target is the price difference between the head and the low point of each shoulder; this difference must be then subtracted from the breakout level, providing a price target (the situation is reversed for the inversed pattern, with the difference being added to the breakout price).
Advantages and Downsides of the Head and Shoulders Pattern
Both the traditional and inversed head and shoulder patterns are considered to be incredibly reliable. However, it’s important to understand that, like other trading patterns, they aren’t bulletproof. Let’s take a look at the unique set of strengths and weaknesses of the head and shoulders patterns:
Head and Shoulders Patterns Benefits
Easy to identify by experienced traders: The head and shoulders pattern chart is highly recognizable, allowing experienced traders to quickly identify potential trend reversals.
Defined risk areas and profit targets: Its design allows the head and shoulders pattern to clearly define entry points, stop-loss, and take profit levels.
Universal for all markets: Whether you trade forex, stock exchange, or crypto, you can effectively use head and shoulders patterns across all markets.
Head and Shoulders Patterns Disadvantages
Can be missed by novice traders: Head and shoulders patterns aren’t always characterised by a flat neckline, which can throw off less experienced traders, causing them to miss the completing pattern.
Large stop loss distances: There’s a risk that the confirmation candle closes far below the neckline, resulting in a large stop distance over a longer timeframe.
The neckline can move: It’s not uncommon for the price to pull back, retesting the neckline and confusing novice traders.
Final Thoughts
The head and shoulders pattern is considered to be one of the most reliable bearish trend reversal patterns. The same goes for its inverse, bullish pattern.
In the hands of an experienced trader, the head and shoulders pattern can be a weapon to be reckoned with. Learning how to use it, however, takes time and practice. Even noticing it can take some time to master.
For this reason, we encourage you to try our CTI Challenge, where you’ll be able to test different strategies using the demo account. Take your time, grow your skills, master your trading craft, and become one of our CTI-funded traders.