


Introduction
Do you keep guessing where the price might turn, only to be wrong more often than you’d like?
You’re not alone. Most traders start with basic volume bars at the bottom of their charts… but those only tell you when people traded, not where the market actually cared.
That’s where the Volume Profile Indicator comes in.
In this guide, you’ll learn exactly how to read and use it — even if you’re brand new to trading. You’ll discover how to spot key price levels, time better entries, and avoid common traps that catch less-informed traders off guard.
Let’s simplify this powerful tool together.
Key Findings
- Volume Profile shows volume at price, not over time, revealing where the market truly traded.
- Key components like POC, HVN, and LVN help identify high-probability support, resistance, and breakout zones.
- Fixed Range and Session Profile are the most reliable tools for consistent analysis.
- Low-Volume Nodes (LVNs) often act as breakout zones, while High-Volume Nodes (HVNs) behave like magnets.
- Volume Profile is best used with price action, supply/demand zones, and multi-timeframe context.
Understanding Trading Volume
Before diving into the Volume Profile itself, it helps to understand volume as a concept.
Volume in trading tells you how many transactions took place during a specific time period.
- In stocks, that’s the number of shares traded.
- In futures, it’s contracts exchanged.
- In crypto, it’s tokens bought or sold.
High volume often signals:
- Strong interest from traders.
- High liquidity (easy to get in and out).
- Cleaner price movement.
Low volume, on the other hand, often leads to:
- Choppy, erratic price behavior.
- Fake breakouts.
- Sudden spikes or slippage.
Bottom line?
Volume is the pulse of the market. But only looking at it over time gives you a partial view.
What Is Volume Profile Indicator?
The Volume Profile Indicator is a trading tool that shows you how much buying and selling happened at each price level — not just when it happened.
Instead of putting volume bars at the bottom of your chart (like most tools), Volume Profile places them along the side, stacked next to the price axis. Each horizontal bar represents the total trading activity at that specific price.
Think of it like a heatmap for prices:
Longer bars = more trades at that price (high interest).
Shorter bars = fewer trades (less interest).
This gives you a powerful edge. You can quickly see where the market “cared” the most and where it didn’t.
Volume Profile Indicator vs. Standard Volume Bars
Most traders start by using standard volume bars — the vertical bars you see at the bottom of your chart. These show you how many trades happened during a specific time period, like a 5-minute or 1-hour candle.
That’s useful, but also limited.
Why?
Because those bars only tell you when trading activity happened. They don’t tell you where in the price range that activity occurred.
The Volume Profile Indicator flips this on its side — literally. Instead of measuring volume over time, it shows you volume at price:
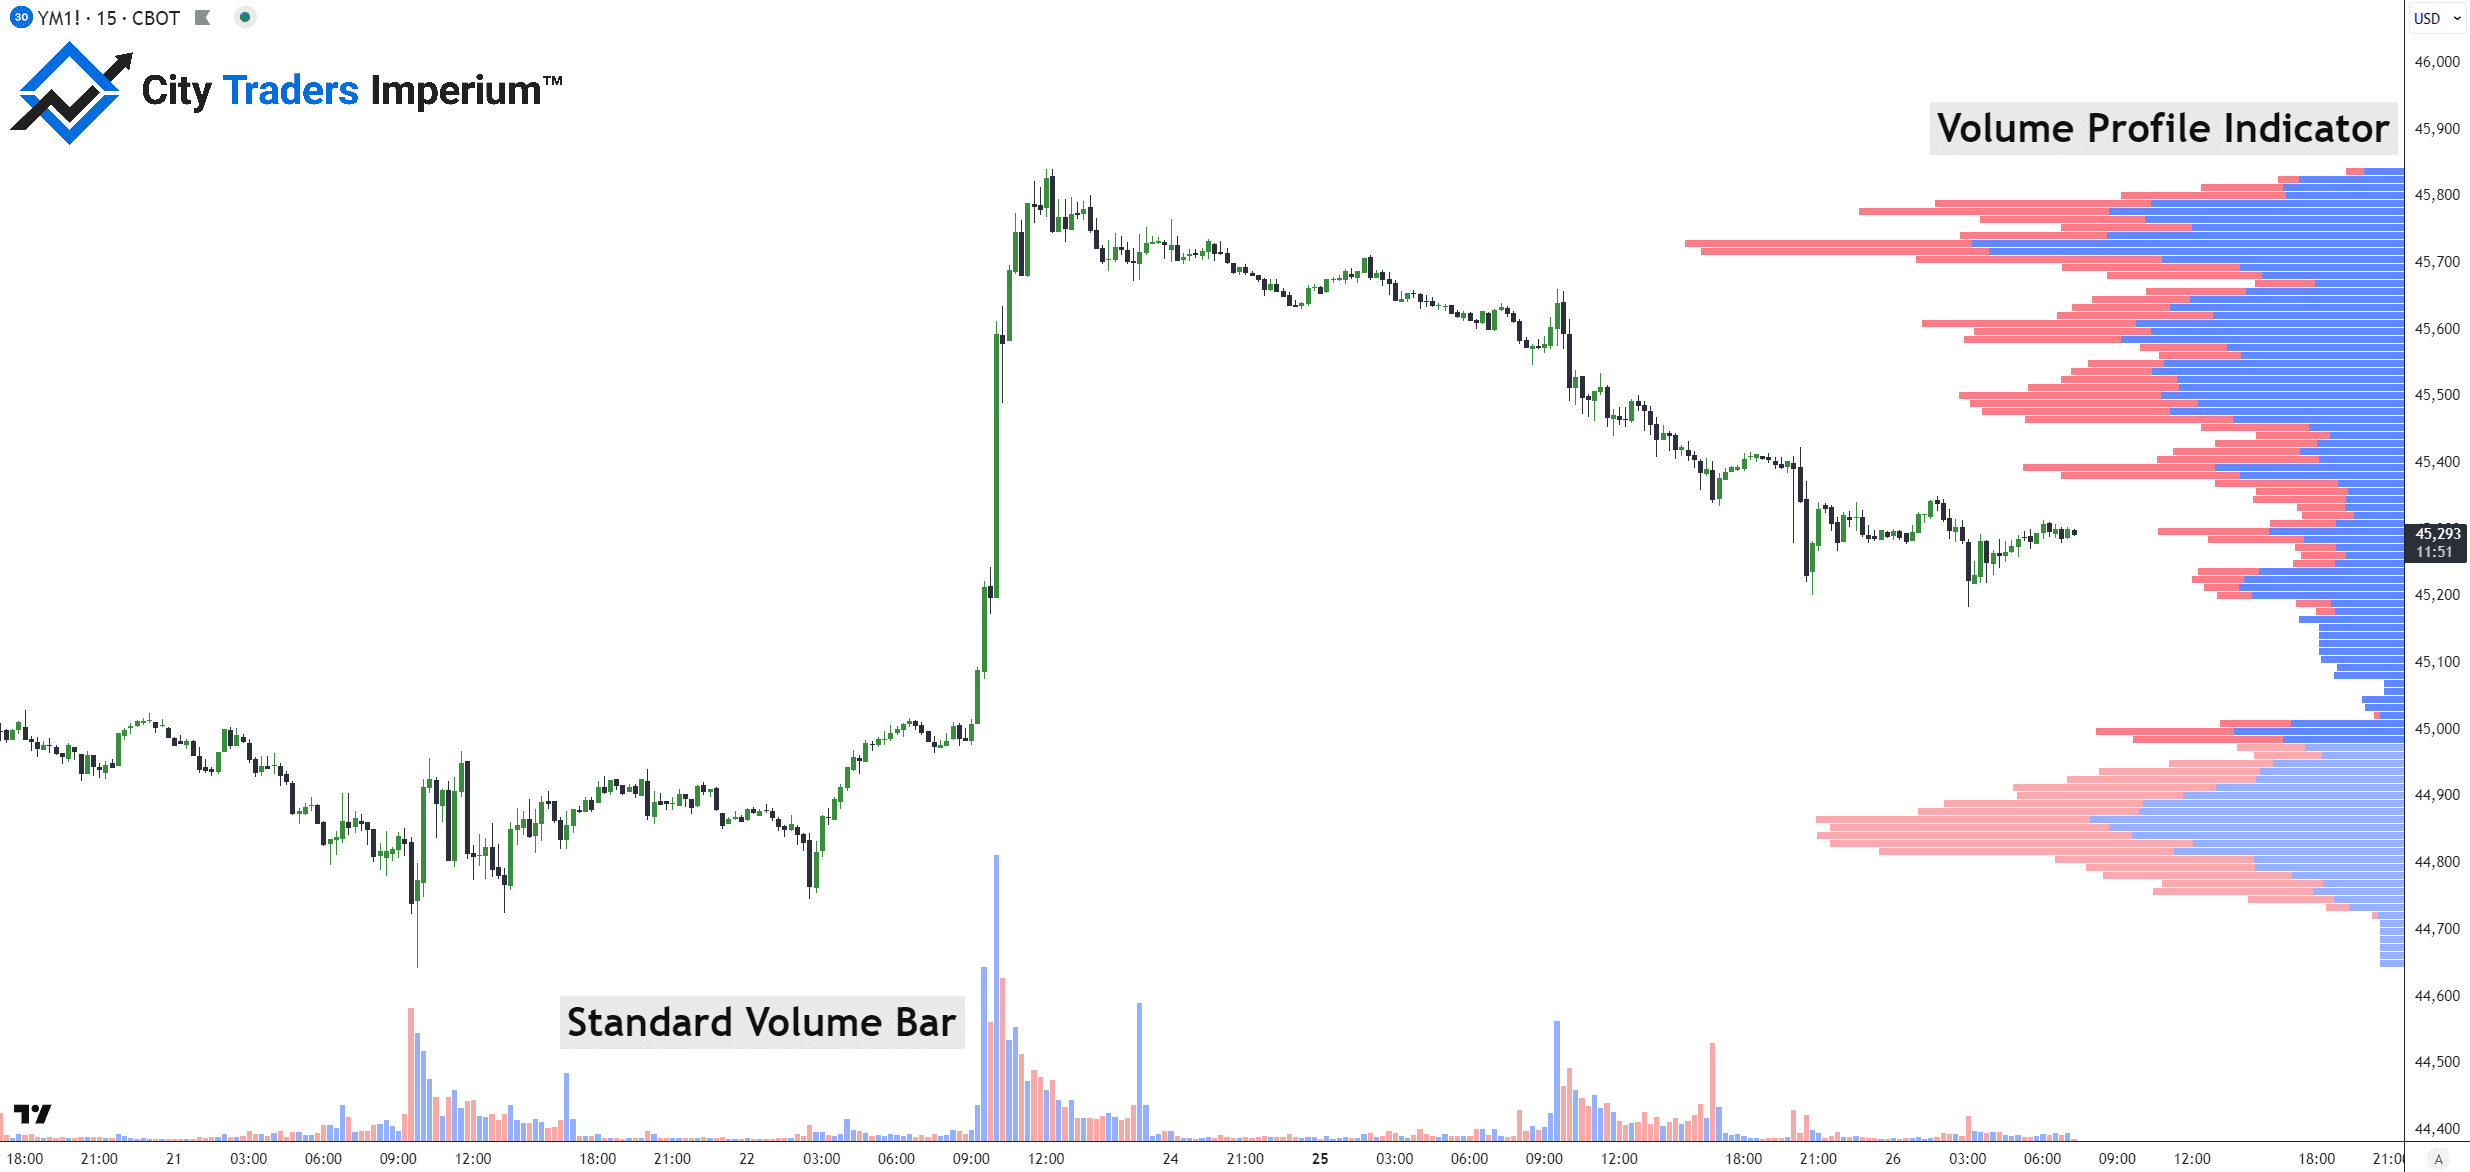
The histogram sits along the price axis, highlighting exactly which price levels attracted the most trading interest.
Here’s the key difference:
Standard volume bars = “Lots of trading happened at 10:00 AM.”
Volume Profile = “Most of that trading happened around $1.2050.”
See the difference? One tells you the clock, the other tells you the price battleground.
How Volume Profile Works (Volume at Price)
When you load a Volume Profile, you’ll see horizontal bars stacked along the price axis on the right side of your screen.
Each of those bars tells you how many trades happened at that exact price. The longer the bar, the more volume was transacted there.
Here’s what to pay attention to:
- X-axis (left to right) = volume
- Y-axis (top to bottom) = price
- The histogram stretches out at price levels with high interest
- It narrows where there was little trading activity
This creates a “volume landscape” across your chart.
How to read it:
Part of the Chart | What It Tells You |
Long horizontal bar | Lots of trading = price stability zone |
Short bar | Low activity = likely breakout zone |
Thick cluster of bars | “Value Area” – where the market was most active |
One longest bar | “Point of Control” – single most-traded price |
This structure reveals where the market accepted price (high volume zones) versus where it rejected it (low volume zones).
Instead of guessing at support and resistance, you can literally see where those zones are based on real participation.
Key Components of a Volume Profile Chart
To get the most out of Volume Profile, you need to understand its core elements. These components tell you where the market sees value, where traders are most active, and where price may move quickly.
Some we’ve already briefly covered, but here’s a more detailed look at the parts you’ll see on every Volume Profile chart:
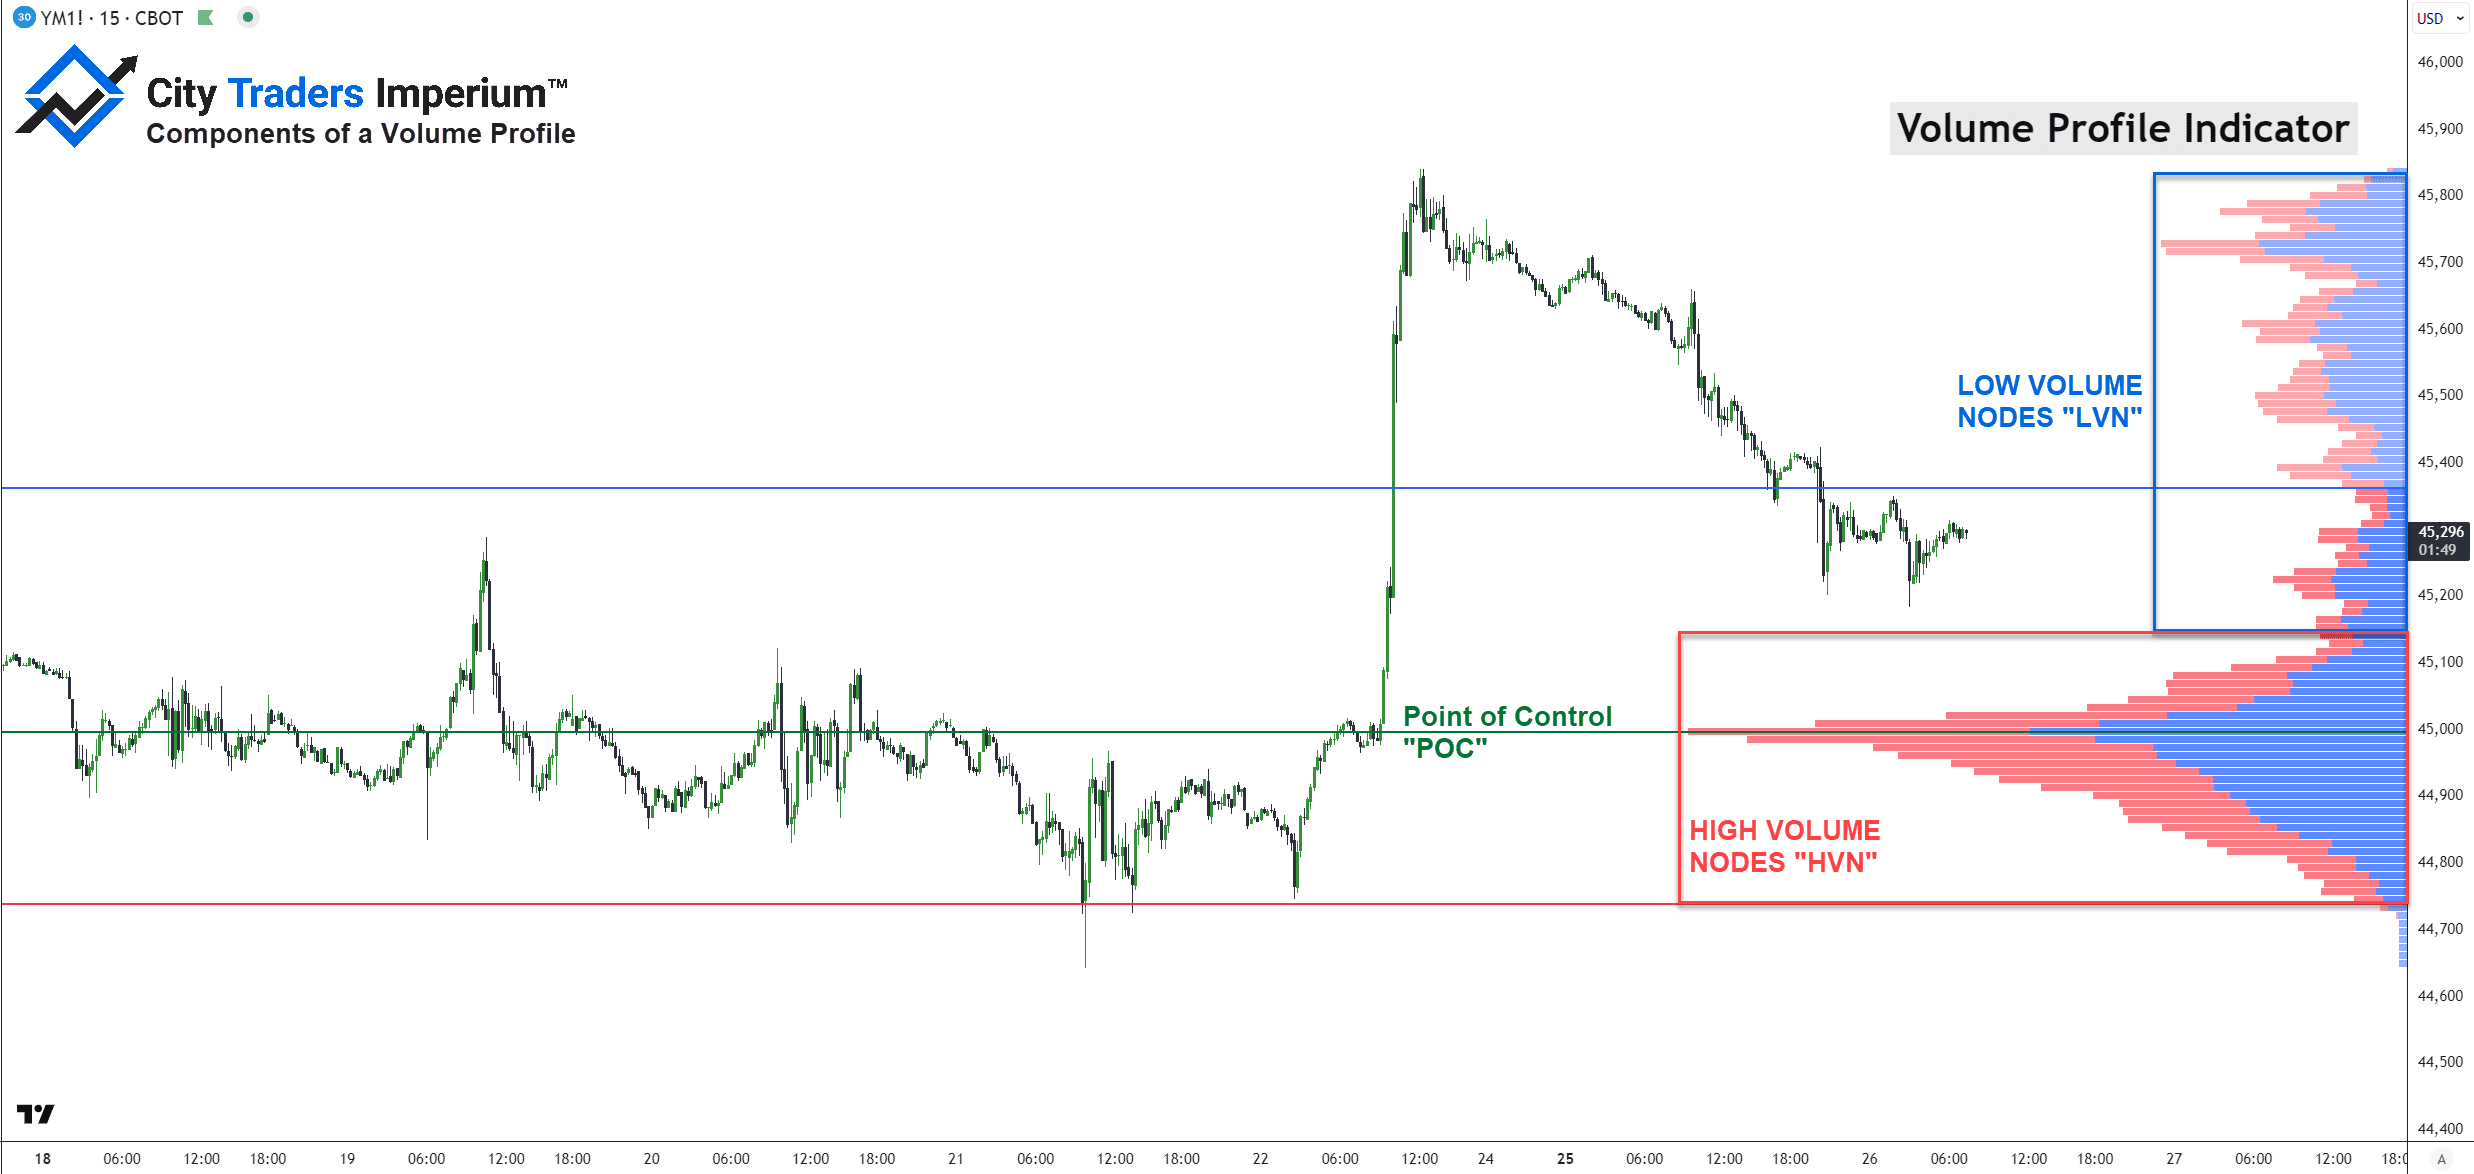
#1 Point of Control (POC)
The Point of Control, or POC, is the price level with the highest traded volume in the entire profile.
- It’s marked as the longest horizontal bar.
- This is where buyers and sellers agreed the most — the market’s “fair price”.
- Acts as a strong magnet for price, and often serves as support or resistance.
Price tends to revisit the POC repeatedly. It’s a high-traffic area on the chart.
#2 Value Area (VA), VAH, and VAL
The Value Area represents the price range where about 70% of all trading volume occurred.
- VAH (Value Area High): The top edge of the value area.
- VAL (Value Area Low): The bottom edge of the value area.
Prices like support and resistance zones often respect these boundaries. Many traders use them for breakout or reversal strategies.
💡 The 70% Rule: Think of the Value Area like the “main stage” of market activity. Anything outside of it is less accepted and more volatile.
#3 High-Volume Nodes (HVN)
High-Volume Nodes are thick clusters of volume at specific price levels, aside from the POC.
- Represent zones of price agreement and stability.
- Price tends to consolidate or pause when approaching HVNs.
- Institutions often build positions here.
HVNs behave like magnets. Price slows down or “sticks” to them because the market has already shown comfort there.
#4 Low-Volume Nodes (LVN)
Low-Volume Nodes are gaps or thin areas in the histogram where very little trading happened.
- These are price rejection zones — the market didn’t spend much time there.
- Price tends to move quickly through LVNs.
- Often used for breakout trades or to identify “fast lanes” for price movement.
LVNs behave like vacuum zones. There’s no friction, so price can accelerate through them.
Types of Volume Profile
Volume Profile isn’t a one-size-fits-all tool. Most platforms offer several variations, each suited for different strategies and timeframes.
The three most common types are:
- Visible Range (VPVR).
- Fixed Range.
- Session (or Intraday) Volume Profile.
You might encounter more, though, depending on your charting software.
Now, while each Volume Profile indicator uses the same concept, they present volume differently.
Essentially, it boils down to preference over what is most suitable for your trading goals. Let’s go through each Volume Profile chart.
Visible Range (VPVR)
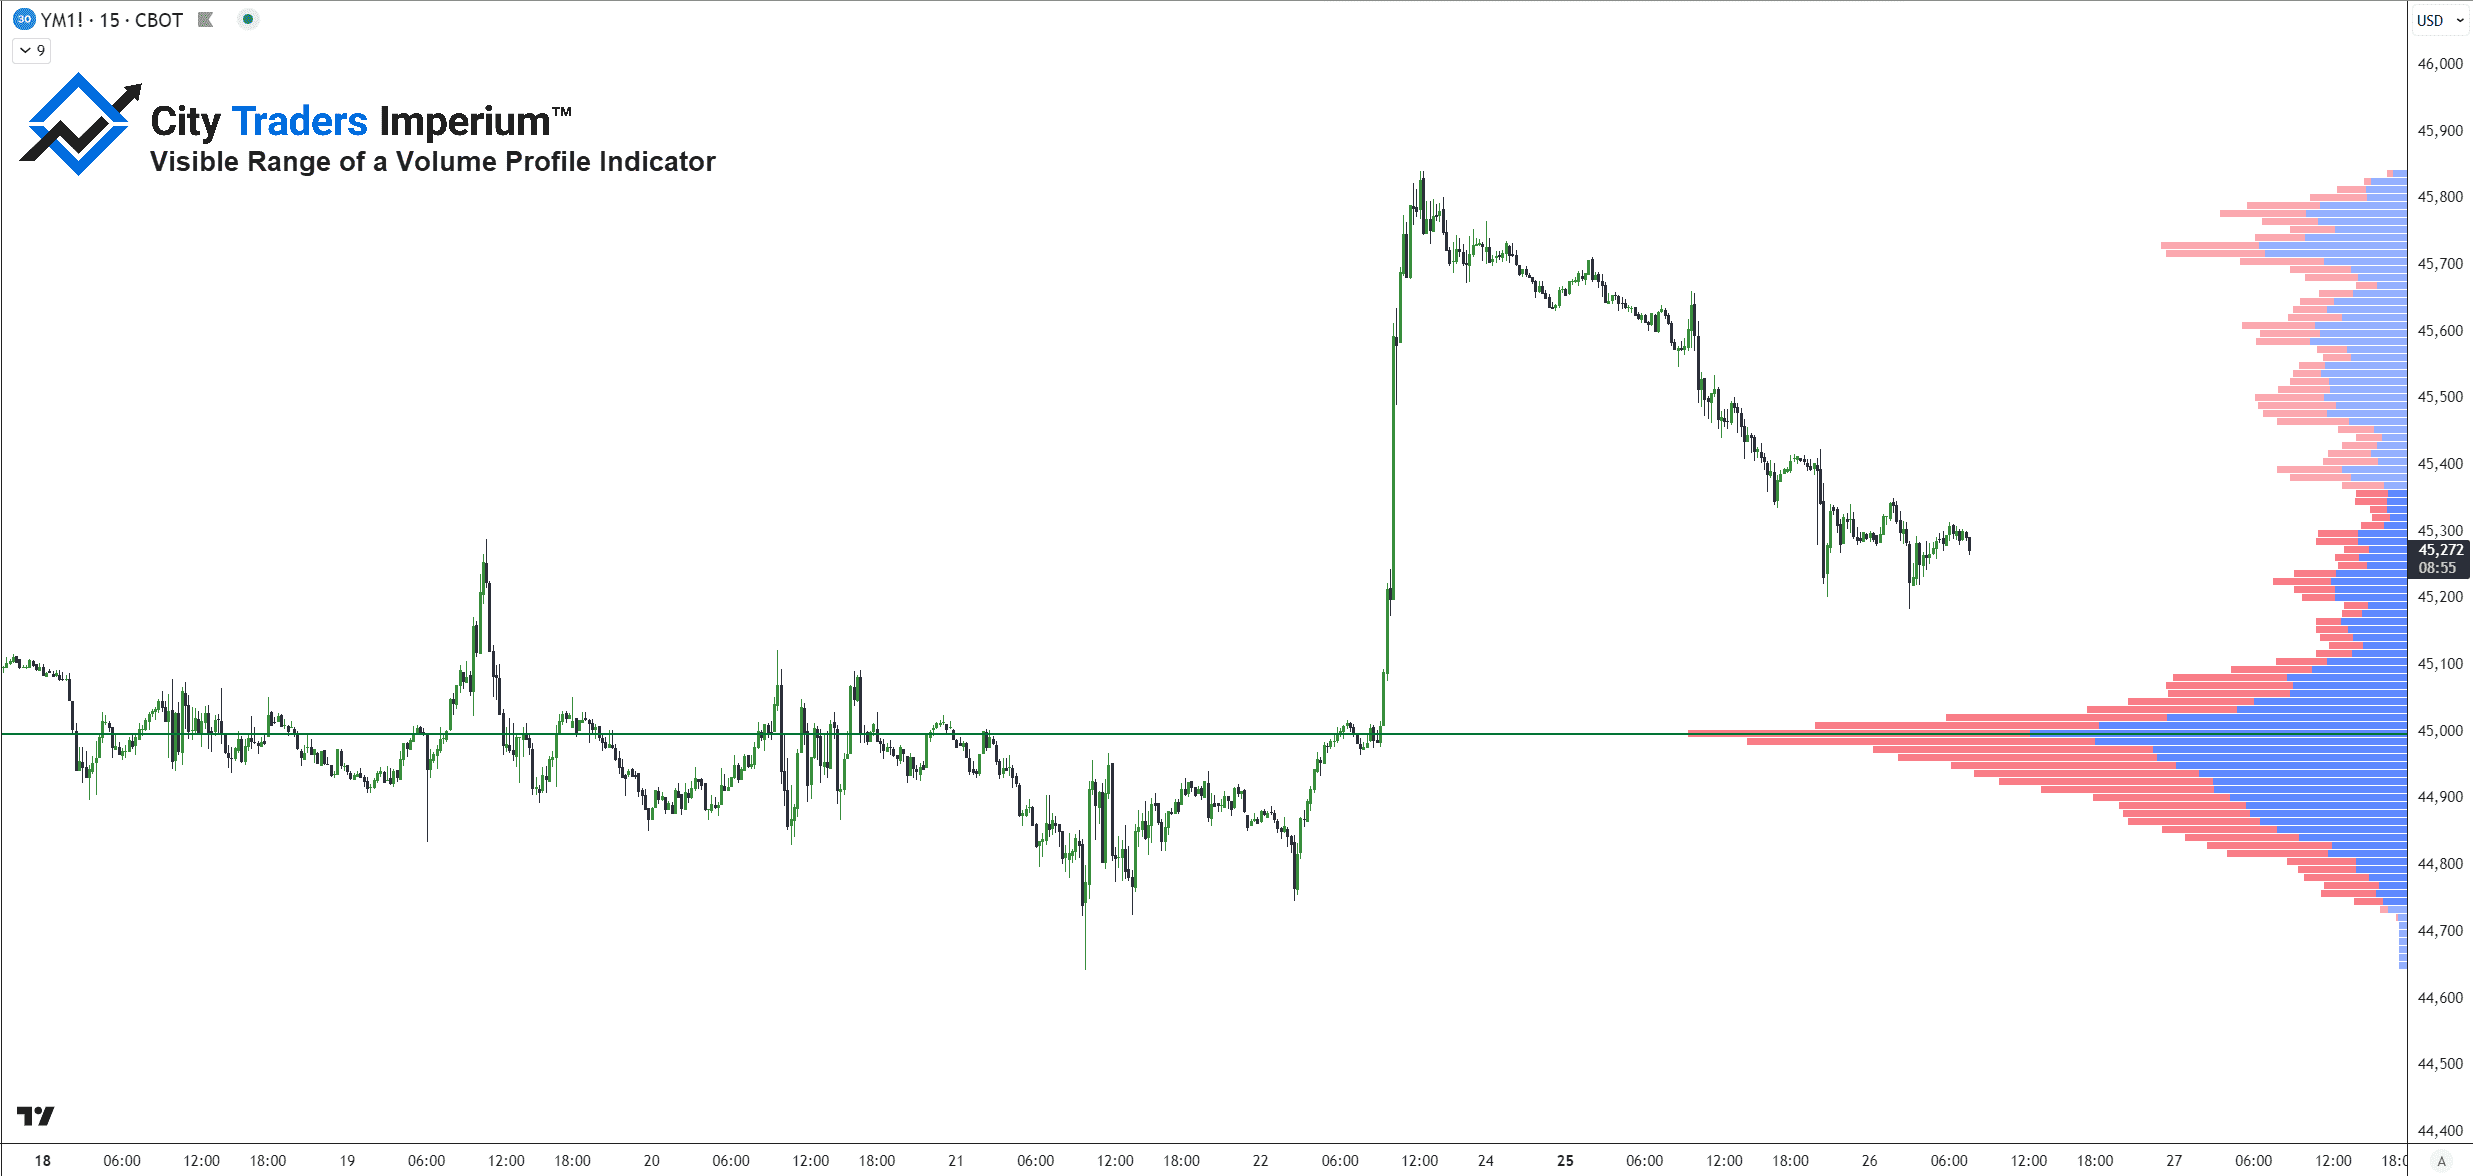
The Visible Range Volume Profile automatically displays the volume histogram for the portion of the chart you’re currently looking at. It dynamically updates as you scroll, zoom in, or move the chart.
At first glance, this tool seems incredibly convenient. You don’t have to configure anything —just add it to your chart, and it shows you the most active price levels for whatever’s visible.
But here’s the downside: it’s subjective.
Because the indicator updates based on your view, the Point of Control (POC) and volume nodes will shift every time you adjust the zoom. This makes it unreliable for precise trade setups or historical backtesting.
Pros: | Cons: |
|
|
💡 Pro Trader’s Tip: Use VPVR for general orientation, but avoid relying on it for entries or exits. It’s like a weather app that changes every time you open it.
Fixed Range Volume Profile
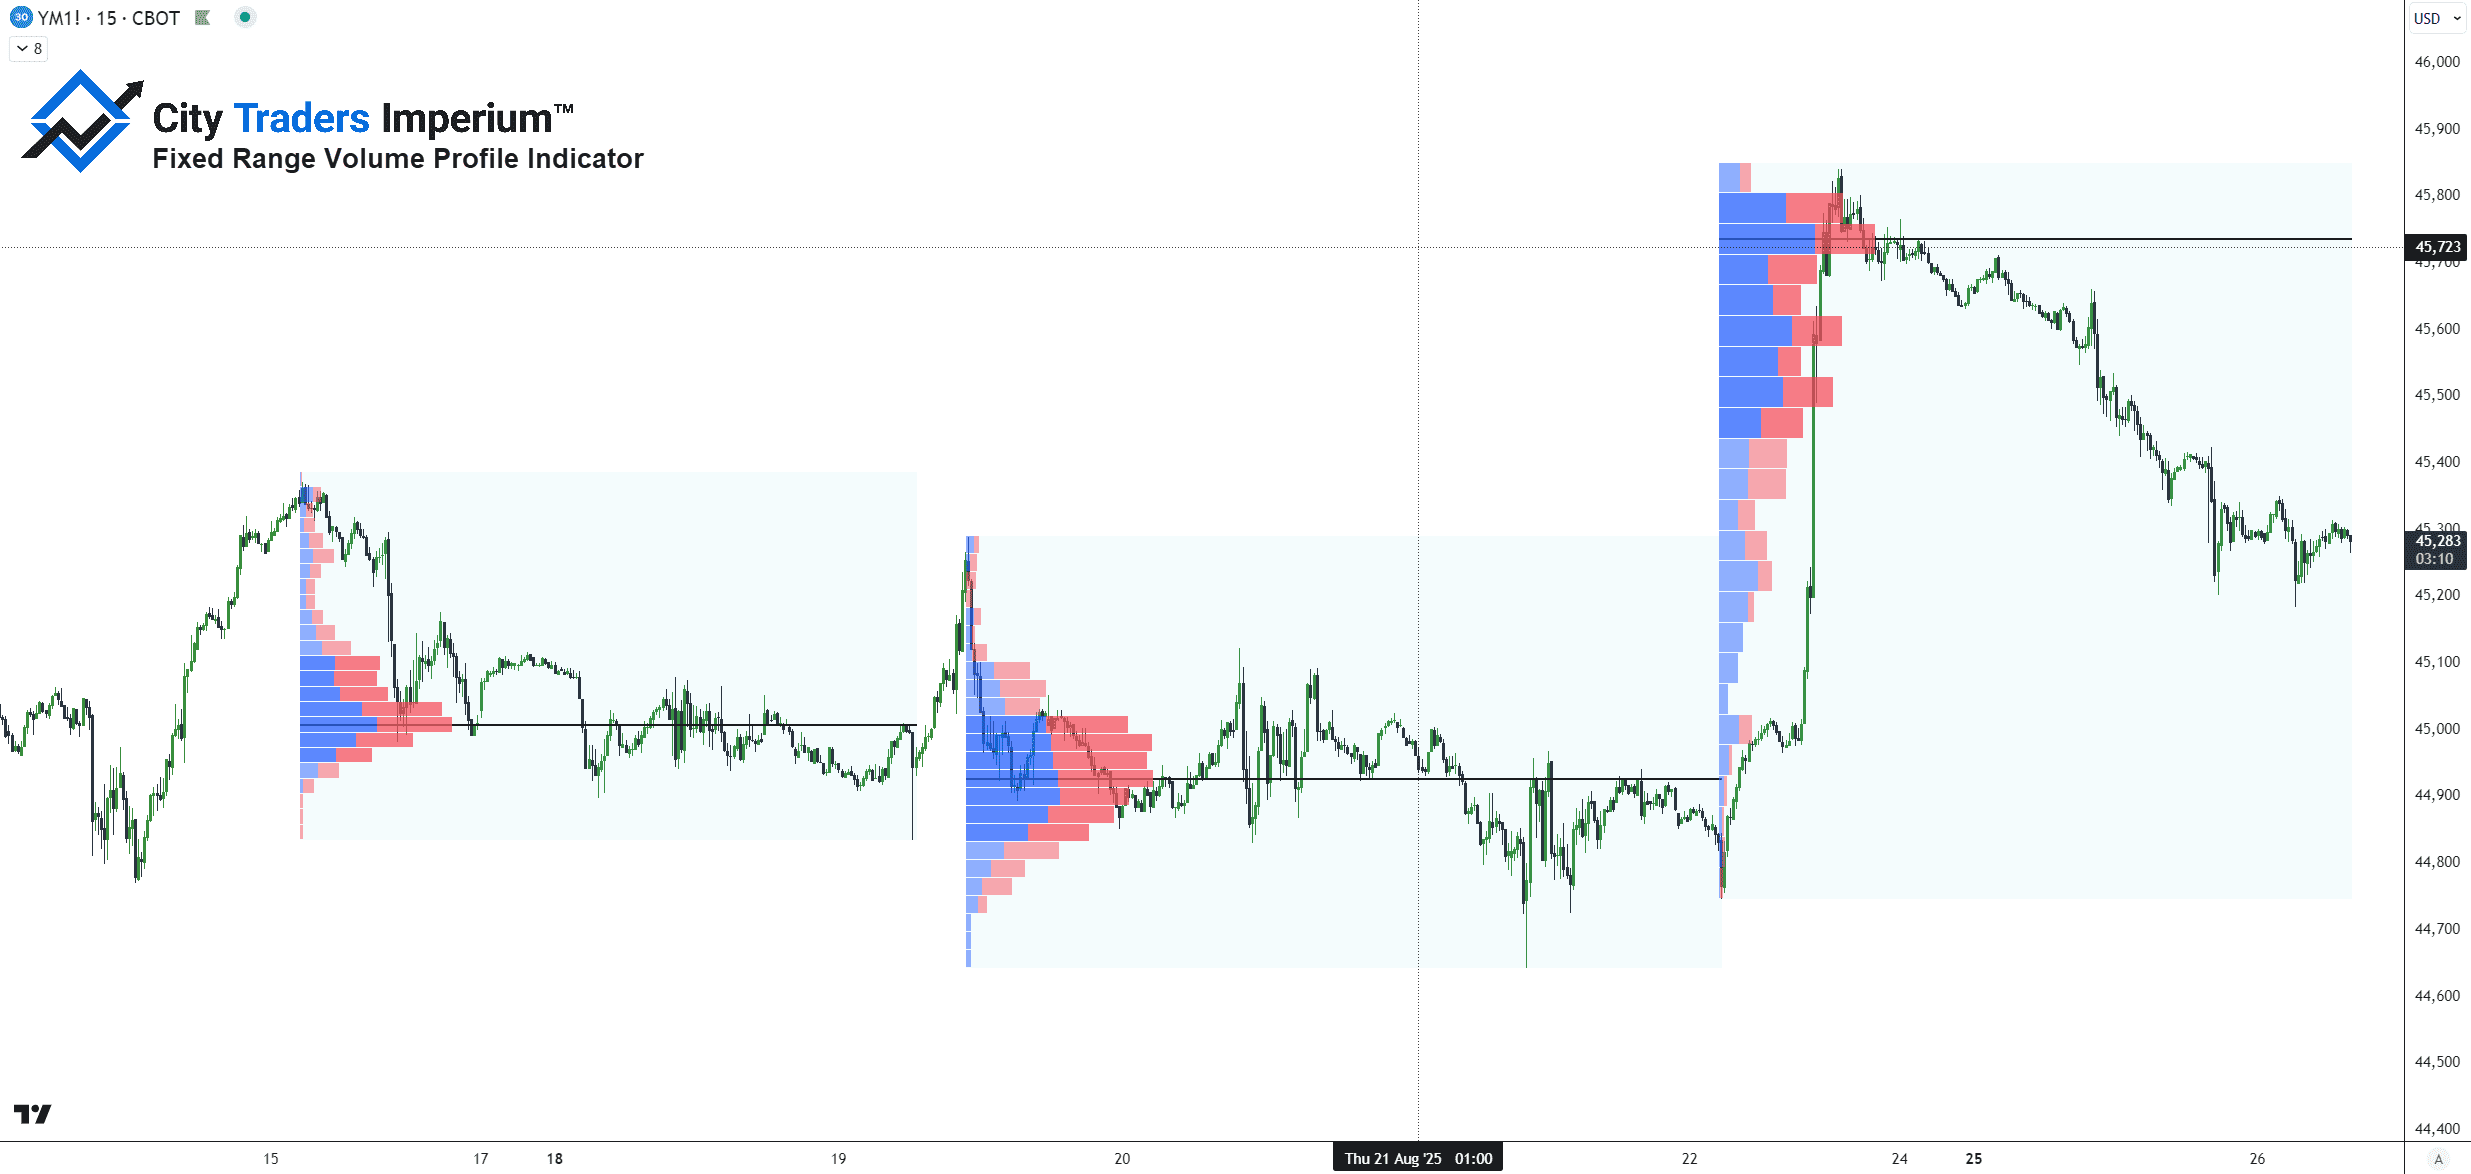
The Fixed Range Volume Profile gives you much more control. Instead of applying to the whole chart or your current screen, this tool lets you select a custom section — usually between two swing points — to build the volume histogram.
It stays fixed no matter how you scroll or zoom.
This makes it ideal for analysing specific legs of a move, whether you’re reviewing a breakout, pullback, or consolidation zone. You can place it over any custom range to reveal where the most volume was traded during that specific phase.
One of the most effective ways to use Fixed Range is for entry planning:
- Identify a major price move or trend leg.
- Select the swing low and swing high.
- Apply the Fixed Range tool to that zone.
- Look for the POC or HVNs as potential entry levels.
✔️ Pros: | ❌ Cons: |
|
|
💡 Pro Trader’s Tip: When in doubt, apply the Fixed Range to the most recent impulse move. This reveals the “footprint” of volume behind the trend.
Session Volume Profile
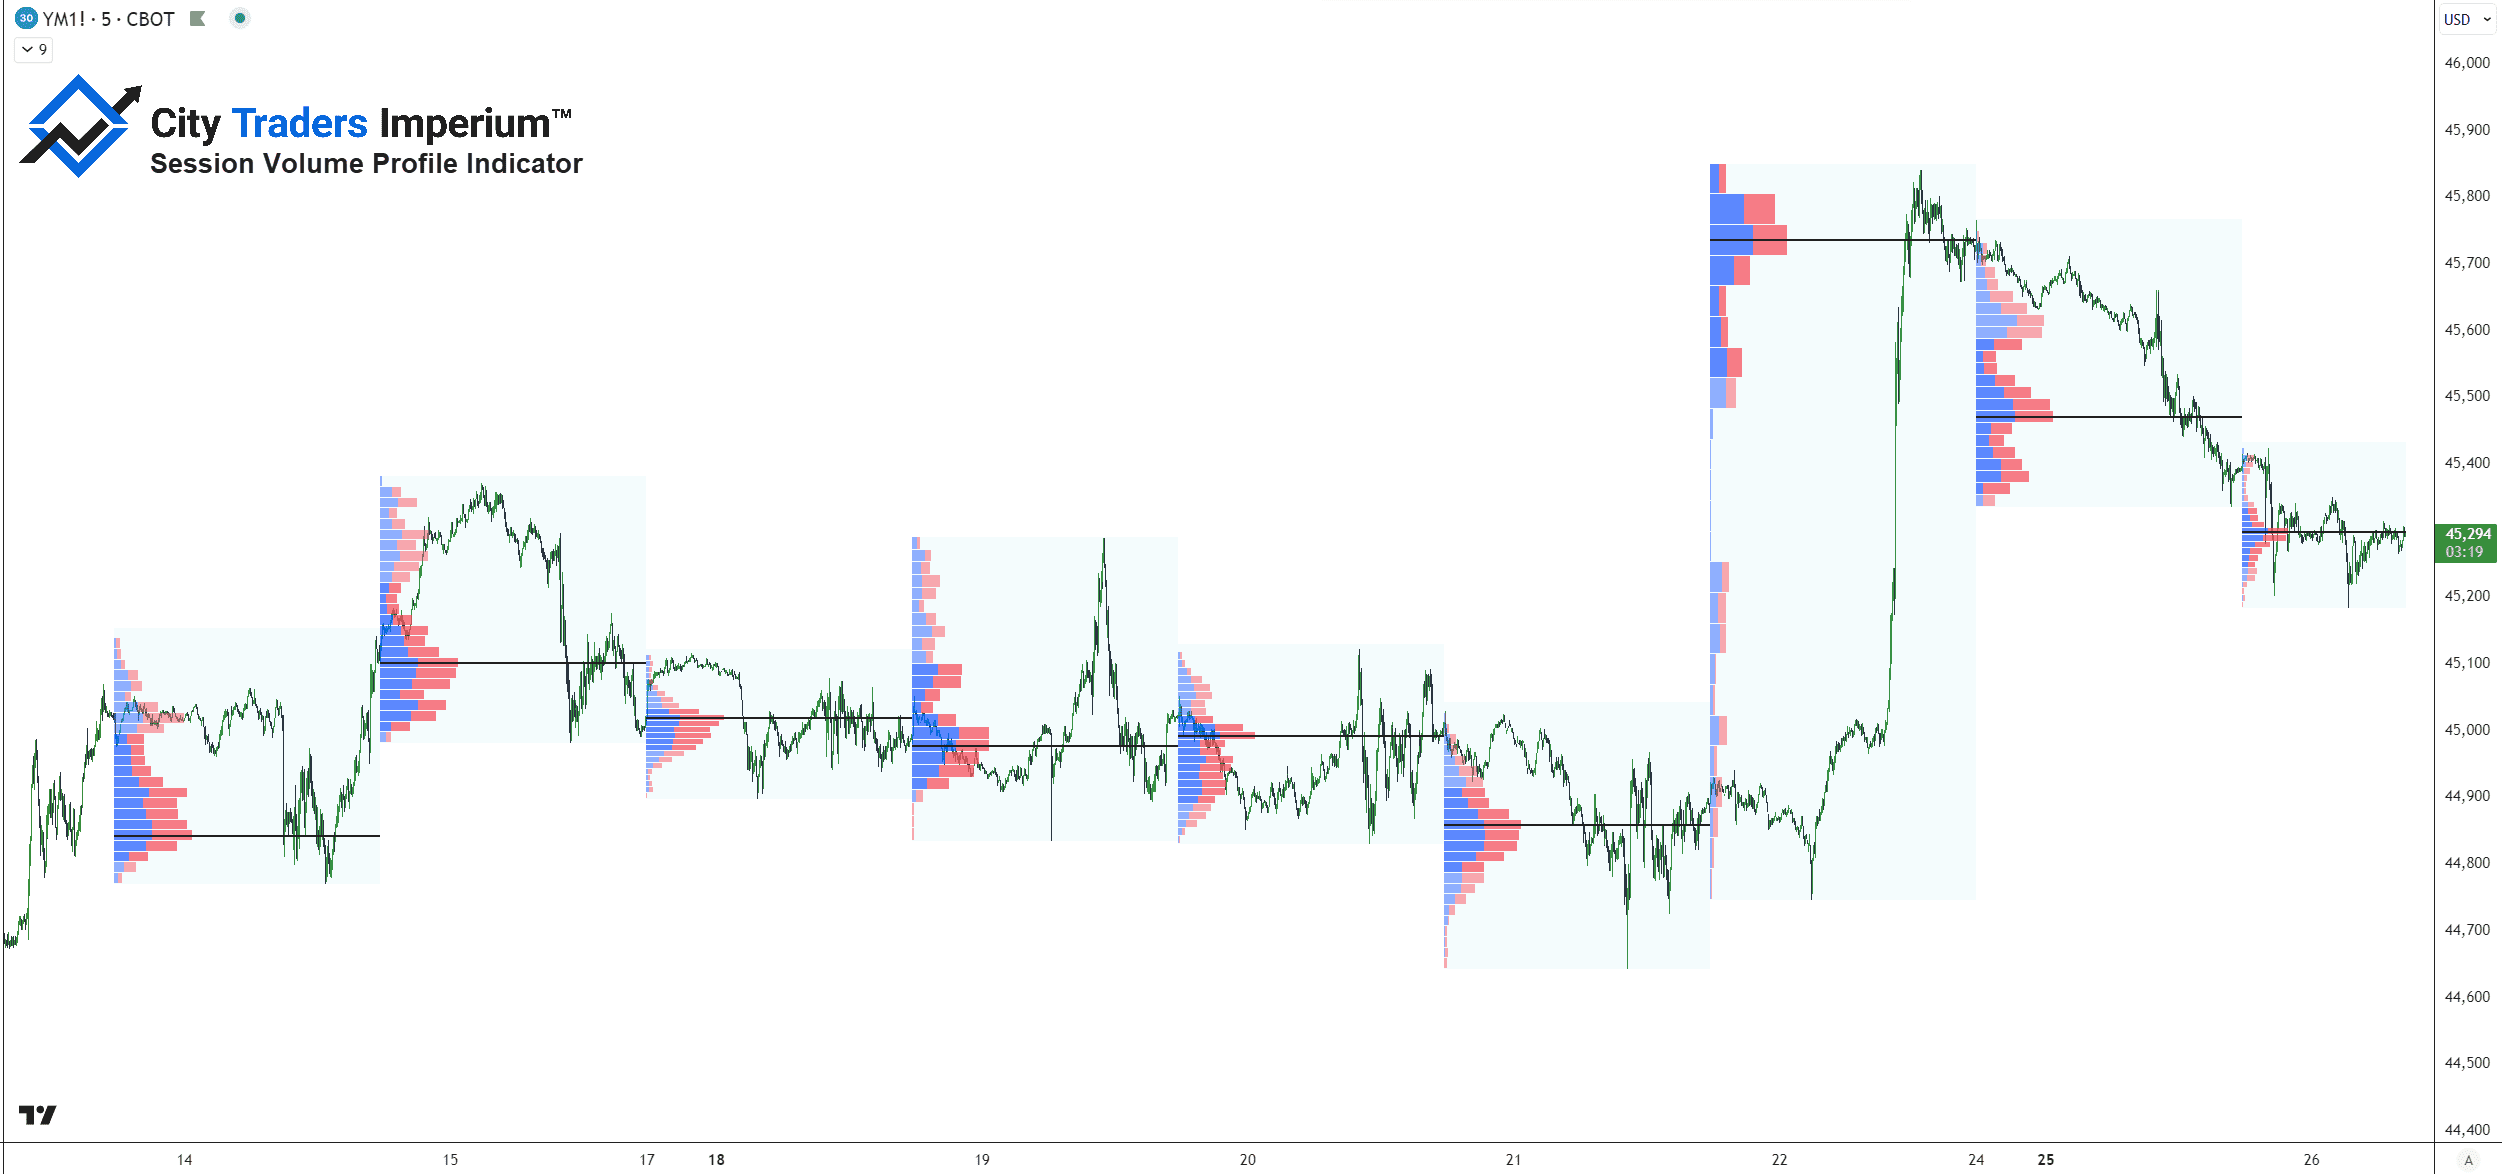
The Session Volume Profile draws a new Volume Profile for each trading session (typically one per day). It doesn’t matter which timeframe you’re on; the session boundaries remain the same.
This version is especially powerful for day traders and scalpers because it gives you a reliable, repeatable way to track volume shifts throughout the trading day.
Each profile has its own:
- POC.
- Value Area.
- Volume Nodes (HVN/LVN).
Many short-term strategies use the POC from the previous session as a potential entry, exit, or reversal zone in today’s trading.
You can also look for confluence between today’s price action and yesterday’s key levels to plan high-probability trades.
Pros: | Cons: |
|
|
Quick Comparison Table
Feature | Visible Range (VPVR) | Fixed Range | Session Volume |
Scope | Current screen view | Custom user-defined range | Per trading session |
Updates as you scroll? | ✅ Yes | ❌ No | ❌ No |
Precision | ❌ Low (subjective) | ✅ High (objective) | ✅ High (session-specific) |
Setup time | ✅ Instant | ⚠️ Manual range selection | ✅ Auto per day (once configured) |
Best for | Big-picture scanning | Entry/exit refinement | Intraday planning |
Skill level | Beginner-friendly | Intermediate | Beginner to advanced |
Why Use Volume Profile? – Key Benefits
What makes the Volume Profile Indicator stand out? Because it shows you what most tools can’t.
Volume Profile doesn’t just tell you how much was traded. It tells you where the real market interest is concentrated. This helps you:
- Stop guessing at support and resistance.
- Avoid traps in low-volume zones.
- Enter with confidence at price levels that actually matter.
Let’s break down the key advantages.
See Where the Market Truly Cares
Unlike traditional indicators, Volume Profile shows you where actual buying and selling took place, not just where the price moved.
This reveals:
- The price levels where institutions and large players were likely active.
- Zones where price is more likely to pause, reverse, or break out.
Identify High-Probability Trade Areas
Using tools like the Point of Control (POC) and High-Volume Nodes (HVNs), you can mark the most reliable support and resistance levels.
These are the “gravity zones” of the chart — price often revisits them, and traders tend to cluster their orders there.
Filter Out Weak Zones with LVNs
Low-Volume Nodes (LVNs) help you spot areas where the market didn’t want to stay. This makes them brilliant for:
- Breakout entries.
- Fast momentum trades.
- Filtering out noisy supply/demand zones.
Improve Timing with Better Context
Volume Profile gives you a layer of insight that price action alone can’t offer.
It lets you see not just the result (candlestick movement), but the intent behind it (where participation happened).
This context is especially helpful when:
- Waiting for pullbacks.
- Judging whether a breakout is real.
- Deciding whether to hold or close a position.
Works Across All Timeframes and Assets
Whether you trade:
- Stocks.
- Futures.
- Crypto.
- Forex*.
You can apply Volume Profile on any chart and any timeframe.
*Note: In Forex, volume data is based on tick volume (number of price changes), not centralised exchange data. Still useful, but interpret carefully.
💡 Mentor’s Tip: Use Volume Profile alongside your existing tools, not instead of them. It’s not magic, but it’s one of the most objective tools you’ll ever add to your strategy.
How to Use Volume Profile – Step-by-Step Strategies
Let’s translate theory into action.
Here’s how to use the Volume Profile Indicator in your trading:
#1 Finding Support & Resistance with POC and HVNs
One of the most powerful uses of Volume Profile is identifying reliable support and resistance zones, based on actual traded volume.
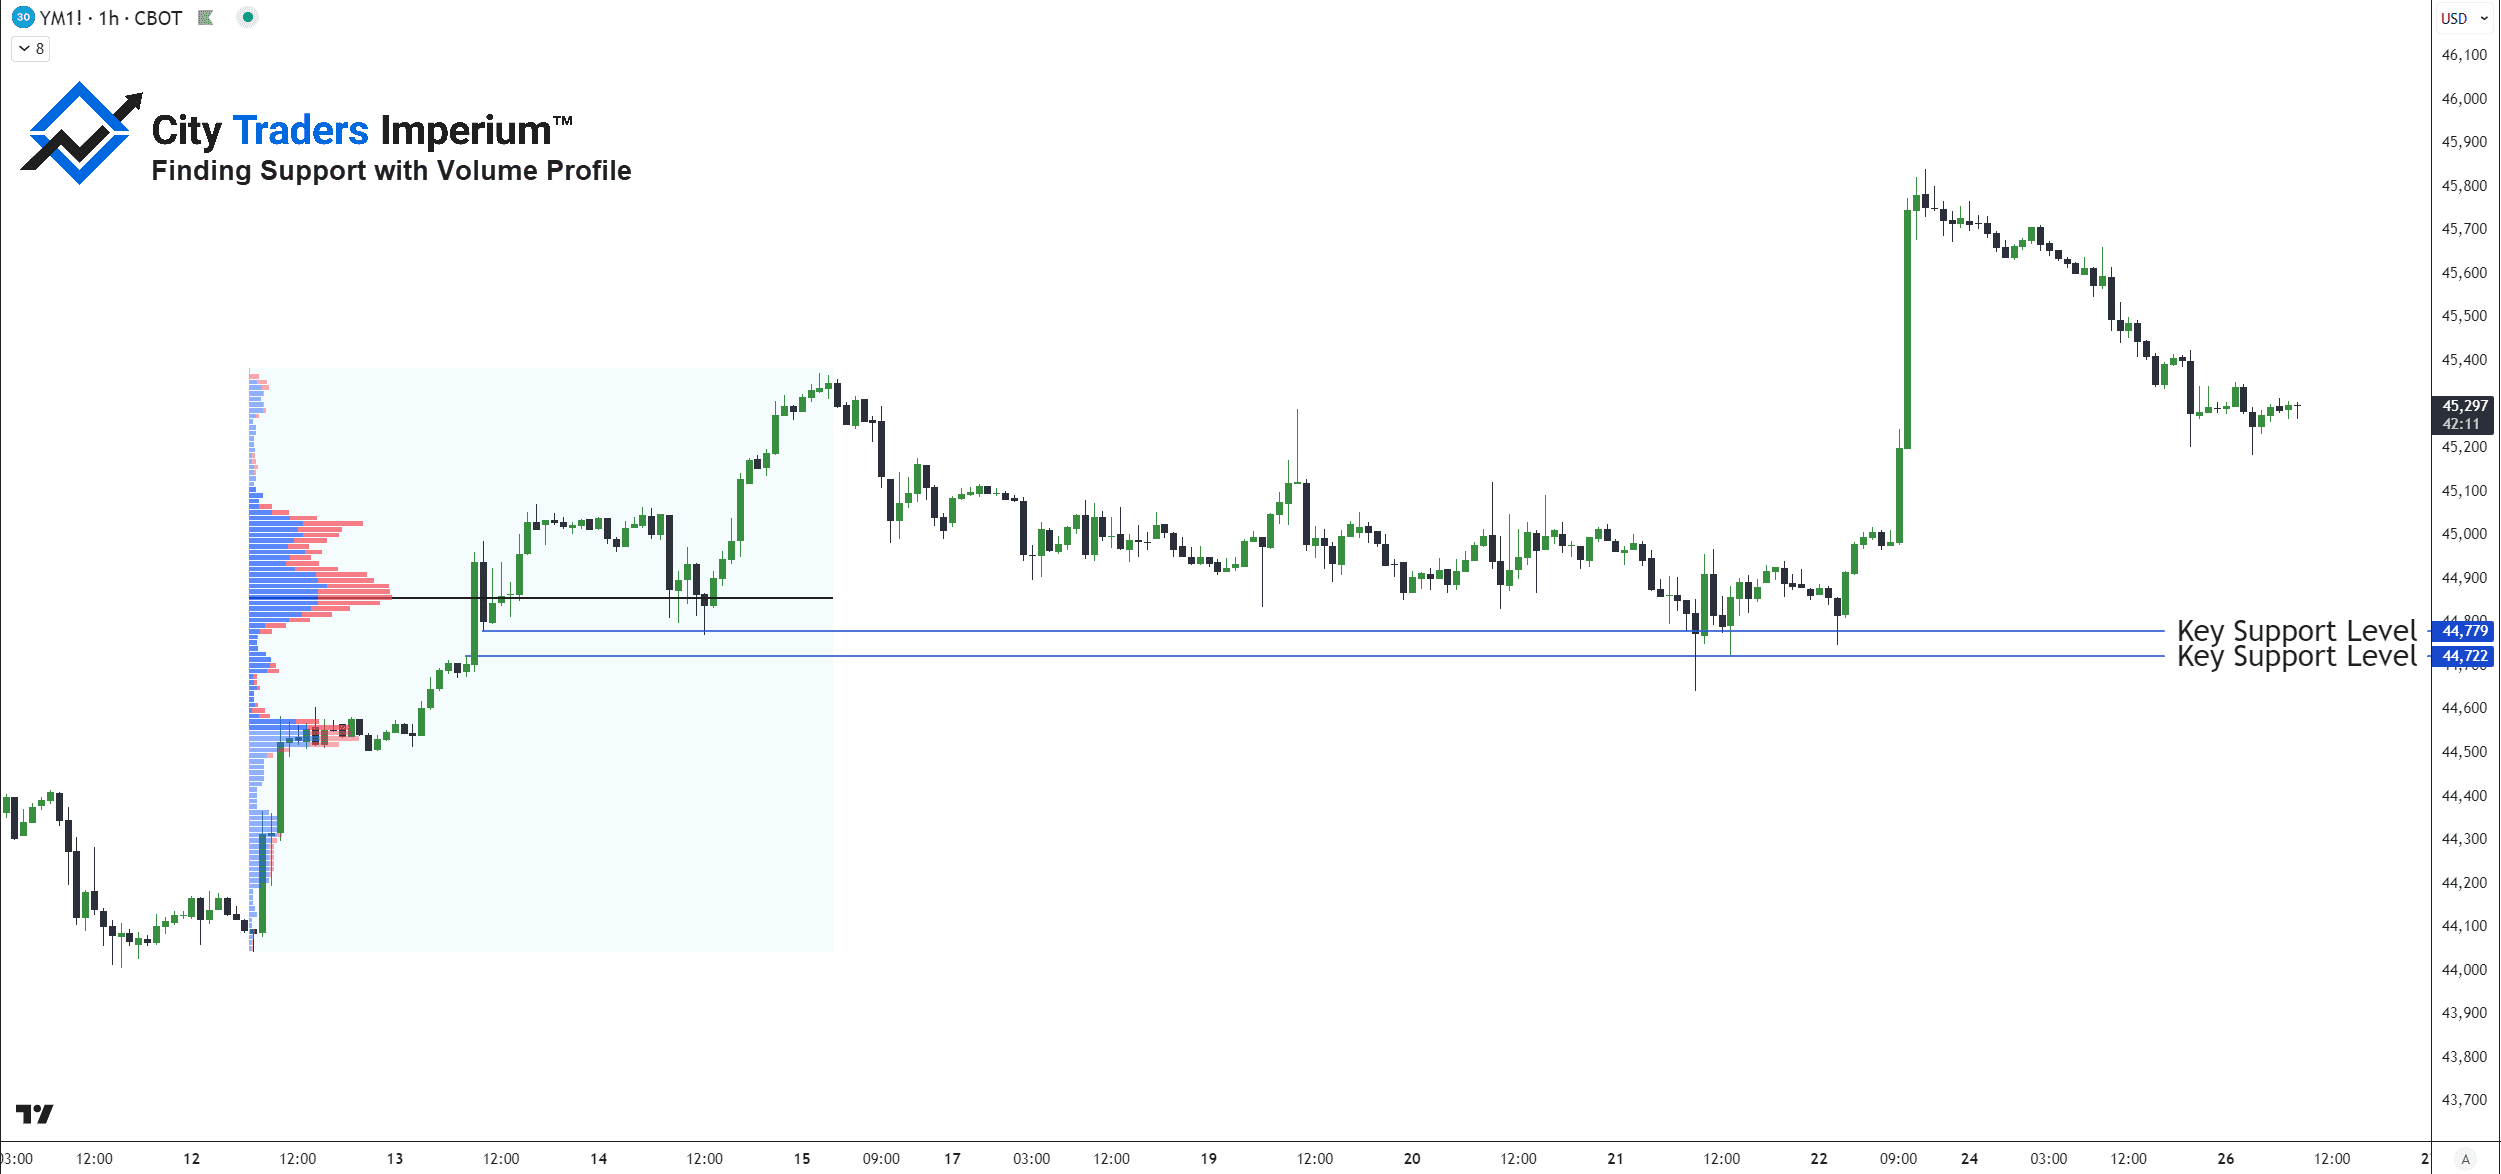
How to do it:
- Apply the Fixed Range or Session Profile to the section you want to analyze.
- Mark the Point of Control (POC)—this is your primary support/resistance zone.
- Identify other High-Volume Nodes (HVNs) nearby.
- Watch how price reacts when returning to these levels—look for bounces, stalls, or clean rejections.
💡 Why it works: POC and HVNs represent price levels where large amounts of trades occurred. These zones often act like magnets, drawing price back and stalling momentum.
#2 Trading Breakouts with LVNs
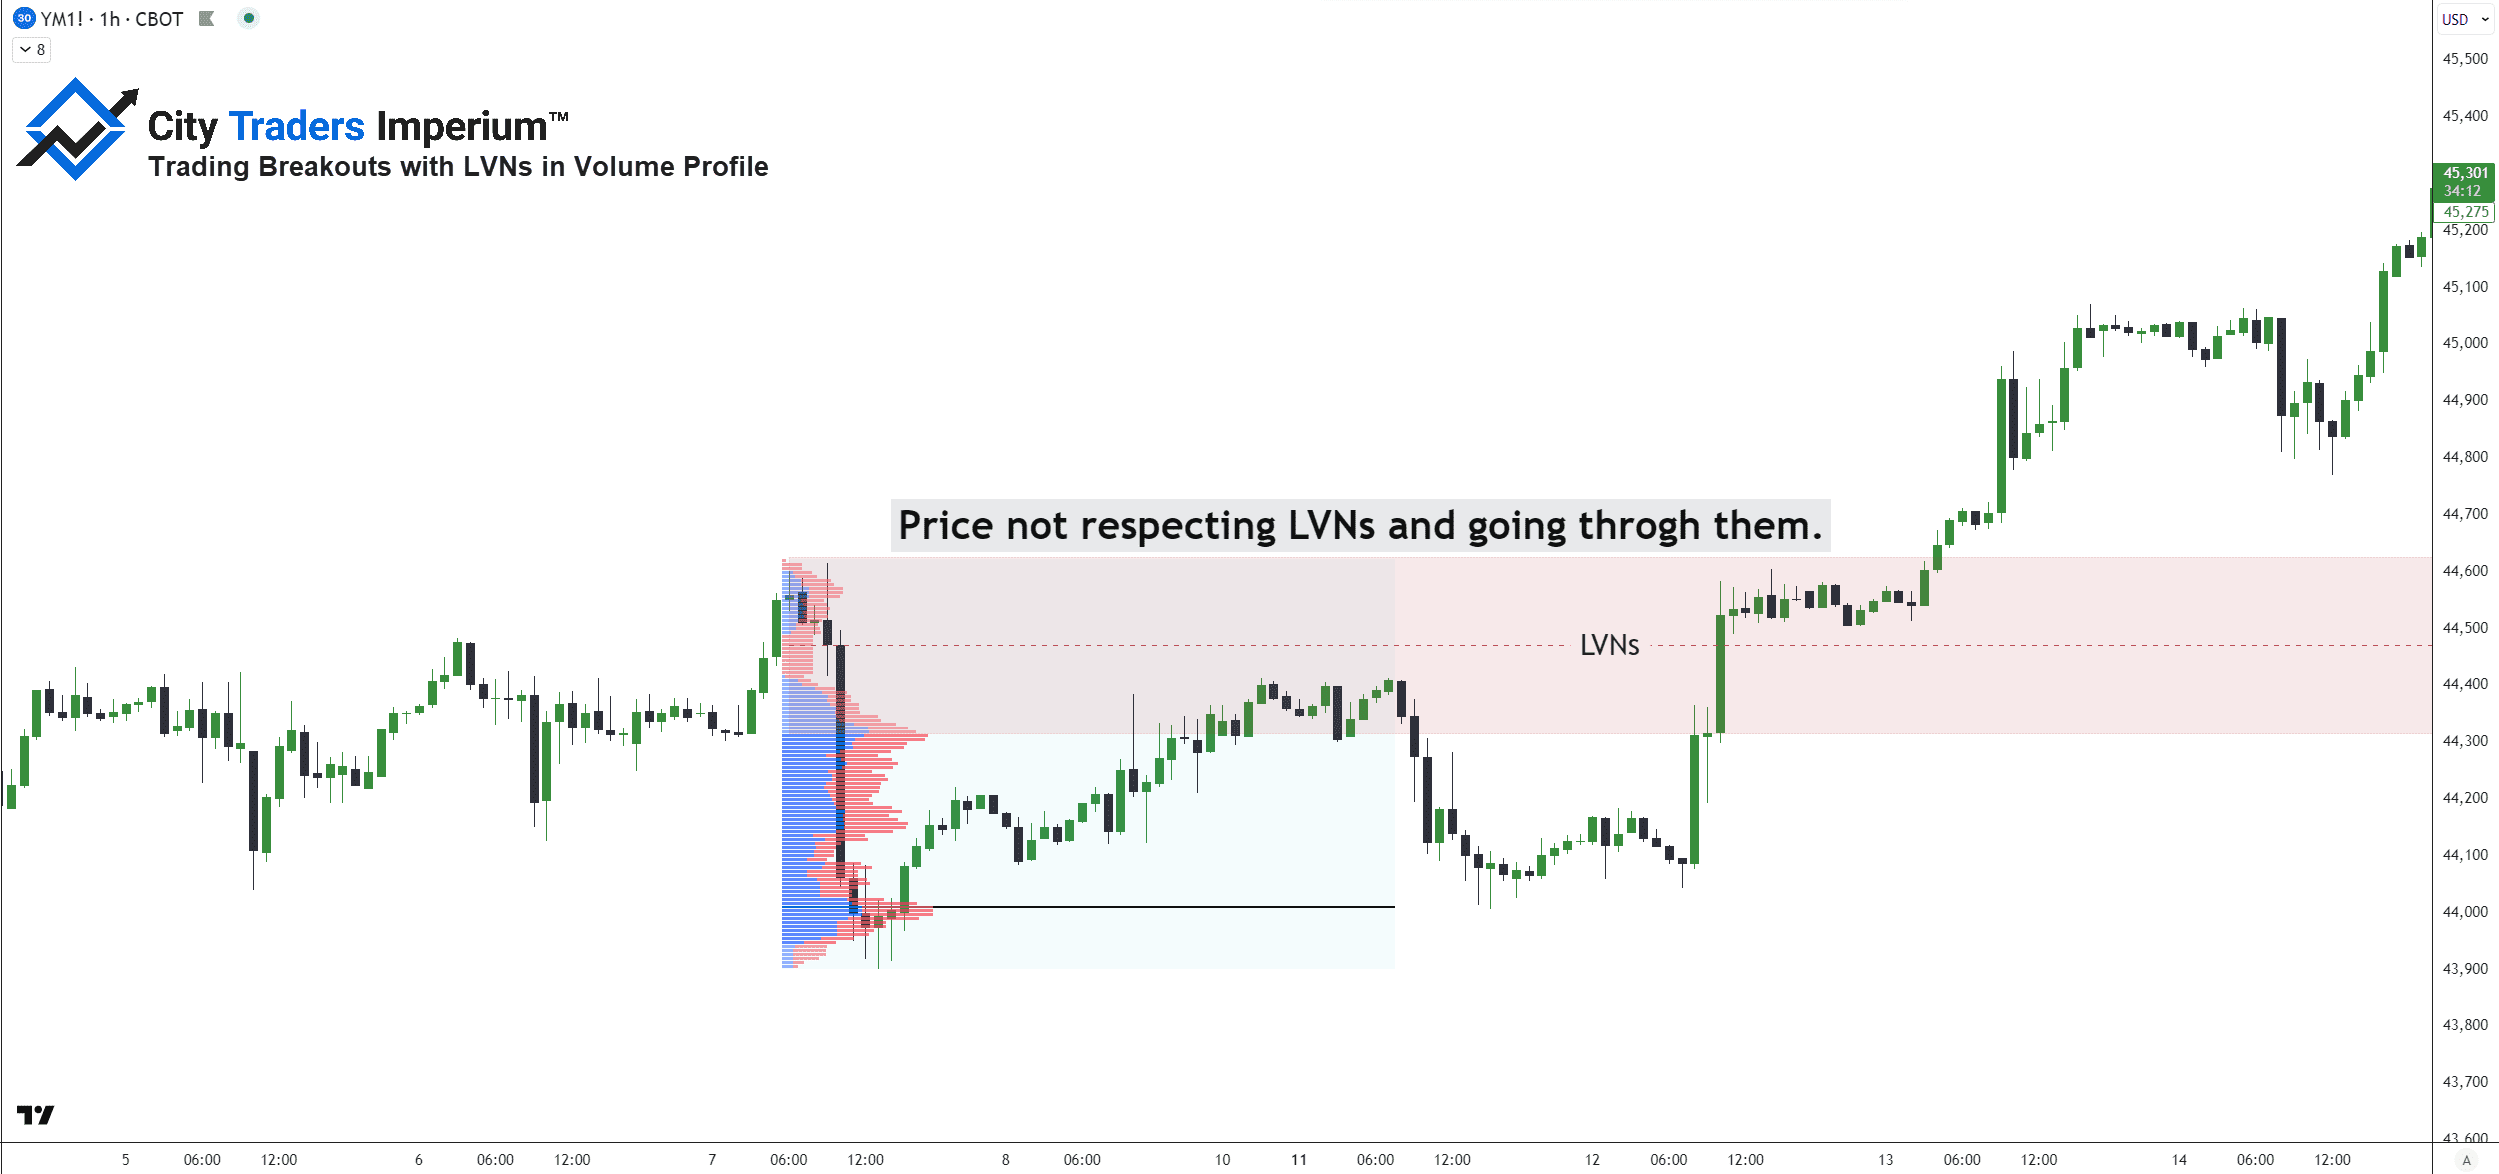
While HVNs attract price, Low-Volume Nodes (LVNs) are the opposite: they represent weak spots in the market’s memory.
How to do it:
- Identify LVN zones in your profile — thin, low-volume areas between major HVNs
- Wait for the price to approach an LVN from either direction.
- Watch for a breakout candle or momentum confirmation.
- Enter the trade and target the next HVN or the outer edge of the Value Area.
- Place stops just beyond the breakout zone or nearest HVN.
💡 Why it works: LVNs are areas the market rejected in the past. Price moves through them quickly because there’s less friction. These zones are ideal for breakout traders.
#3 Combine Volume Profile with Price Patterns
Volume Profile becomes even more powerful when paired with traditional price action.
How to do it:
- Look for classic patterns: double bottoms, flags, triangles, engulfing candles.
- Apply the Fixed Range to that zone or swing.
- Use Volume Profile to confirm the strength of the zone.
- For example:
- If a demand zone has an HVN: strong base.
- If a supply zone lines up with an LVN: potential breakout trap.
- Use Confluence for entries and risk placement.
💡 Why it works: Price patterns show structure; Volume Profile shows commitment. When they agree, your setup has stronger odds.
#4 Use a Multi-Timeframe Approach
One of the smartest ways to trade with Volume Profile is to combine higher-timeframe context with lower-timeframe entries.
How to do it:
- Start on a higher timeframe (Daily or 4H).
- Apply a Visible or Fixed Range Profile.
- Mark key levels: major HVNs, POC, VAH/VAL.
- Drop down to a lower timeframe (15m–1H).
- Look for price to test those higher-level zones.
- Enter based on intraday signals: breakouts, rejections, pullbacks.
💡 Why it works: Higher timeframes define the “big picture.” Lower timeframes let you fine-tune your entries with better precision and tighter risk.
(Advanced) Volume Profile Shapes: P, b, D, and B
Some traders also use the shape of the profile to read market sentiment.
Each shape tells a different story about how price and volume interact:
Profile Shape | What It Means | Trading Implication |
P-Shape | Short squeeze or breakout to upside. | Bullish reversal or continuation. |
b-Shape | Long liquidation, trapped longs. | Bearish reversal or continuation. |
D-Shape | Balanced market, sideways structure. | Ranging – mean-reversion likely. |
B-Shape | Accumulation at the bottom, possible breakout. | Bullish buildup (but less common). |

How to use it:
- Apply a profile (preferably Session or Fixed).
- Look at the distribution of the histogram.
- Compare the shape to the above table.
- Trade based on the expected directional behaviour.
How to Add Volume Profile to Your Chart
You’ve learned what Volume Profile is and how to use it. Now, let’s get it on your screen.
The good news is that most modern platforms support Volume Profile, but the process varies slightly depending on where you trade.
Here’s how to set it up on TradingView:
1. Open the chart for the asset you want to analyze.
2. Click on the “Indicators” button at the top of your screen.
3. Type “Volume Profile” in the search bar.
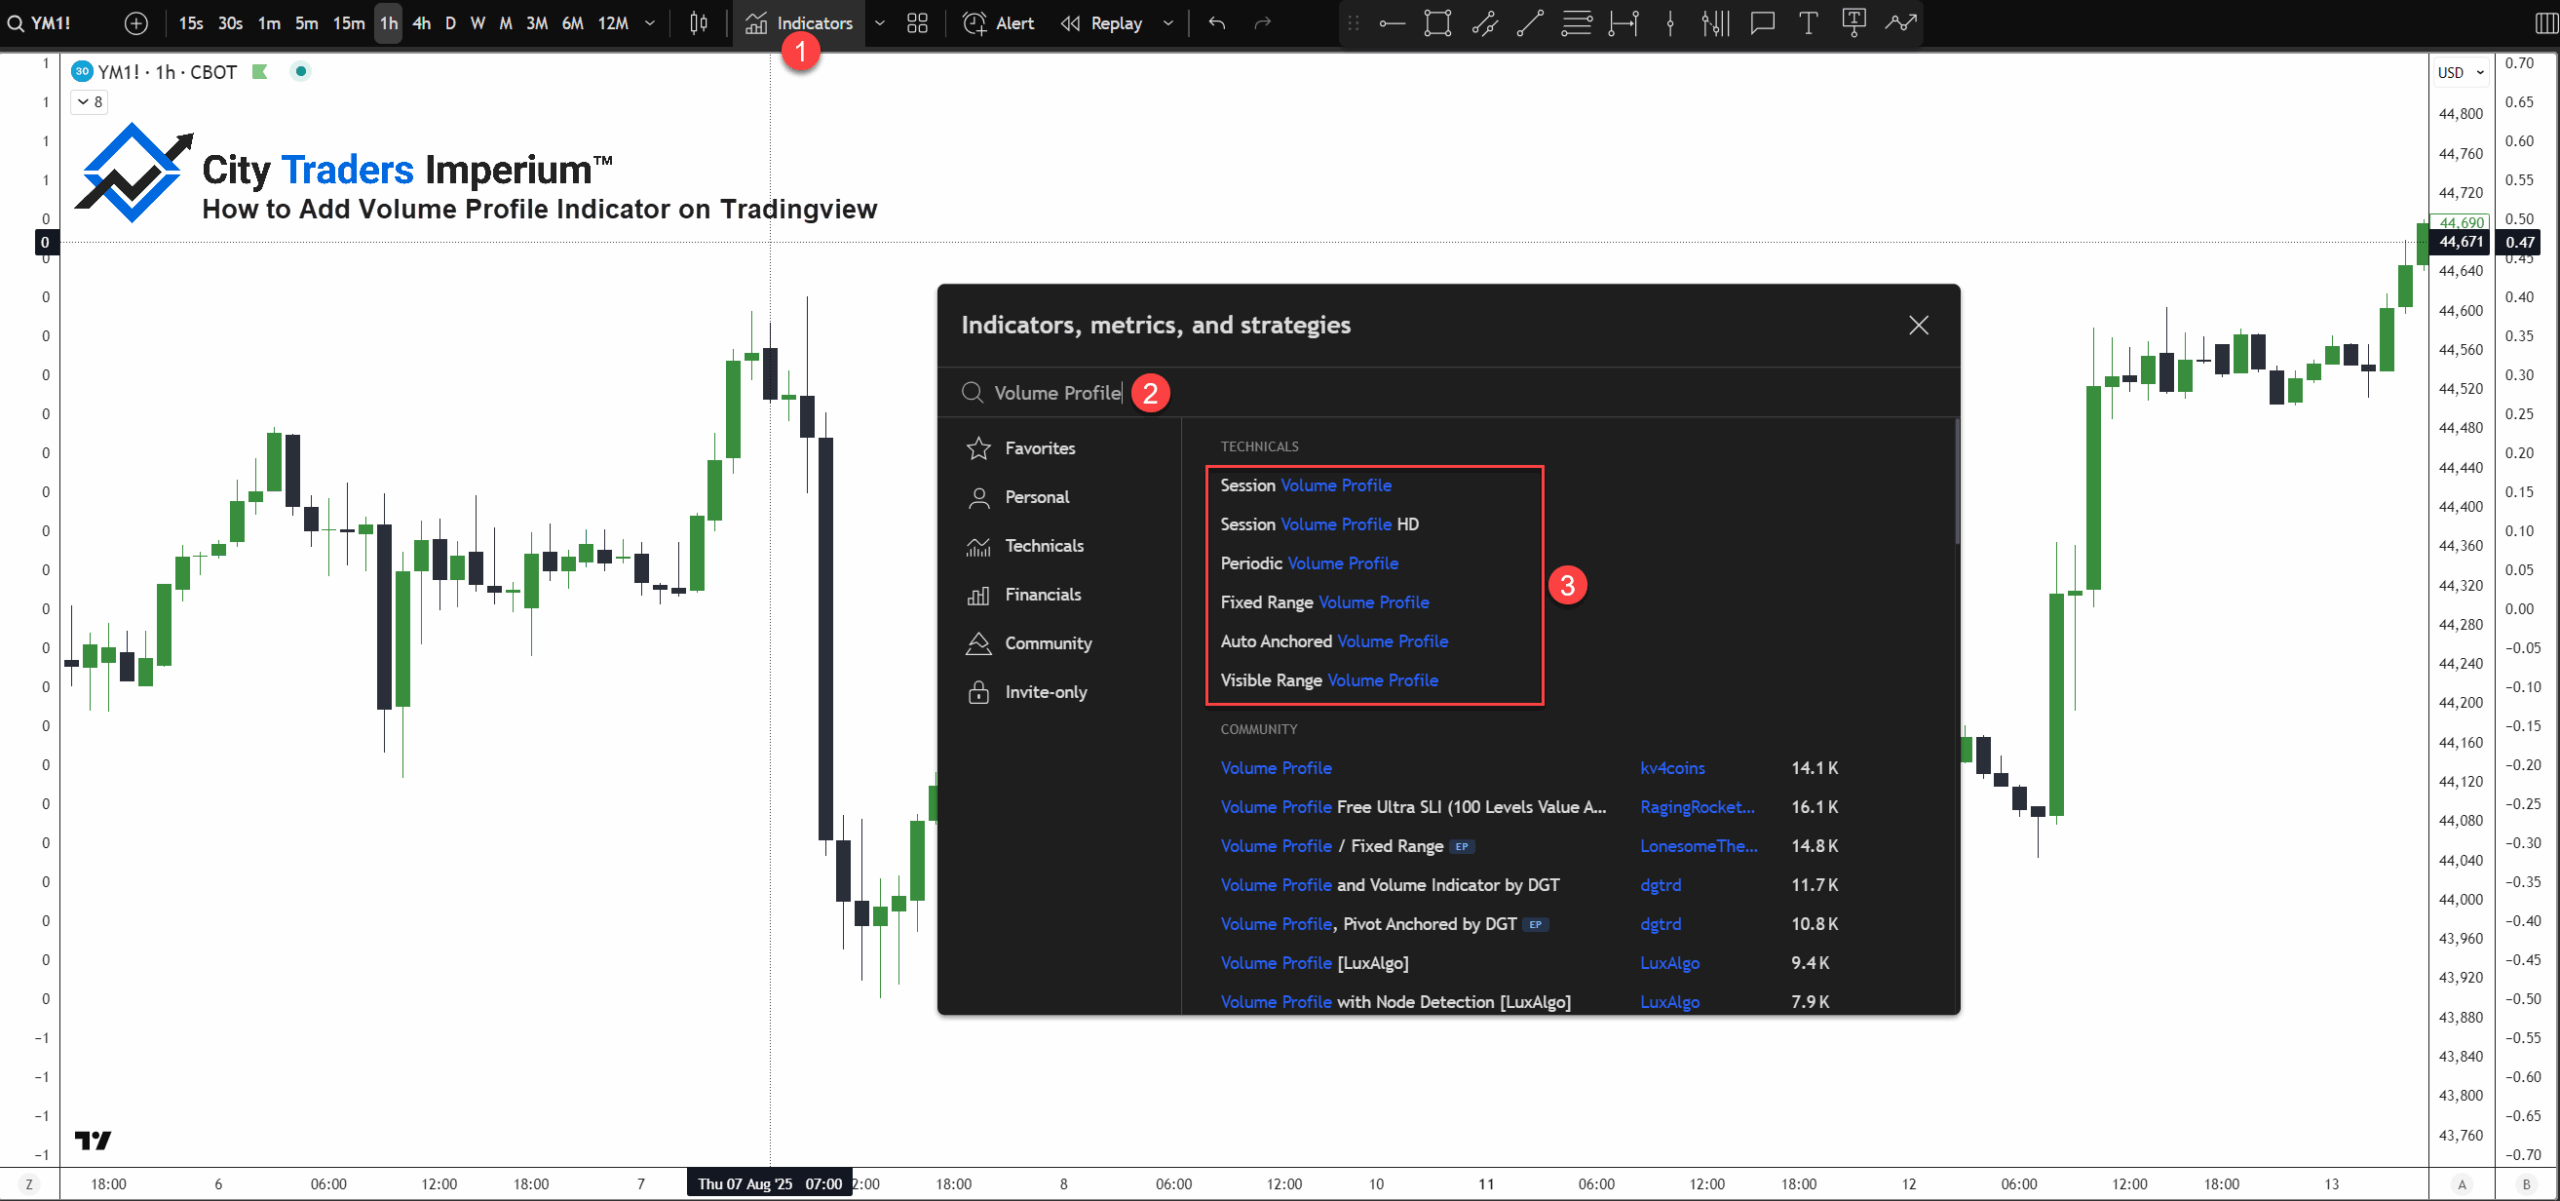
4. Choose the version you want:
- Visible Range = Volume Profile (Visible Range).
- Fixed Range = Volume Profile (Fixed Range).
- Session = Session Volume.
Once applied, the indicator will appear along the right side of your chart.
Using Volume Profile with MT4/MT5
Volume Profile isn’t included by default on MetaTrader 4 or 5.
To use it on MT4/MT5, you’ll need:
- A custom plugin or
- A third-party Volume Profile indicator (often paid).
Make sure to verify:
- It uses real volume data.
- It’s compatible with your broker’s feed.
- It has decent reviews and responsive support.
Pro Tips & Best Practices
Volume Profile is a powerful tool, but like anything in trading, it’s only as good as how you use it. Here are some seasoned tips to help you get the most out of it:
Tip #1: Start with a Clean Chart
Volume Profile gives you a lot of information. If your chart is already packed with moving averages, trendlines, indicators, and fibs, it can become overwhelming.
💡 Our tip: Strip your chart down to price and Volume Profile. Build from there.
Tip #2: Use Fixed or Session Profile for Precision
Visible Range (VPVR) is handy for scanning, but it’s dynamic and inconsistent. If you’re making trade decisions, switch to:
- Fixed Range for analysing trends or patterns.
- Session Profile for daily setups and entries.
Tip #3: Let the Profile Do the Talking
It’s tempting to over-analyse. But Volume Profile already shows you where volume built up and where it didn’t.
💡 Our tip: Don’t force signals. Trust the data. If the POC or HVNs are aligning with your trade idea, great. If not, move on.
Tip #4: Focus on Reaction Zones, Not Predictions
You’re not trying to “predict” the market. You’re reading where it’s likely to react.
Use:
- POC and HVN are areas to expect stalls or reversals.
- LVNs as zones of potential breakouts or quick movement.
Tip #5: Combine with Price Action, Not Instead of It
Volume Profile shines brightest when it’s confirming what you already see in the candles.
For example:
- Is that support level backed by a high-volume node?
- Is a breakout happening at an LVN?
- Are patterns forming around the POC?
This kind of confluence increases your edge.
Tip #6: Use Alerts for Key Levels
Once you’ve marked your important levels (like yesterday’s POC or a weekly HVN), set alerts so you’re not glued to the screen.
Volume Profile Limitations to Keep In Mind
As useful as Volume Profile is, it’s not a magic bullet. Like any trading tool, it has some important limitations, and knowing them can save you from costly mistakes. Here’s what you need to watch out for:
⚠️ It’s a Lagging Indicator:
Volume Profile shows you where volume occurred in the past. It doesn’t forecast future moves. That means it works best for identifying potential reaction zones — like support, resistance, or consolidation areas — not for predicting what price will do next.
⚠️ It’s Less Reliable in Decentralised Markets:
Unlike stocks or futures, forex doesn’t run on a central exchange. Most brokers only provide tick volume, which counts the number of price changes, not the actual number of contracts traded. While tick volume often correlates well with real volume, it’s not precise.
⚠️ Quality Depends on Your Platform and Data Feed:
Not all Volume Profile tools are created equal. Some platforms offer detailed volume histograms with custom settings, while others only provide basic visualisations. If your tool lacks clear POC/VA levels or uses unreliable volume feeds, you could be working with distorted data.
⚠️ It can’t Show You the Type of Volume:
Volume Profile shows how much was traded at each price, but not how or why. It doesn’t tell you whether those trades were aggressive (market orders) or passive (limit orders). For example, a high-volume node could simply reflect a large amount of passive absorption, which is not true market interest.
⚠️ Easy to Overuse or Misread:
One of the biggest mistakes traders make is forcing Volume Profile onto every chart or setup. Just because a chart has volume clusters doesn’t mean they’re significant. Volume Profile should support your existing thesis, not replace it.
💡 CTI’s Reminder: Volume Profile is a context tool — not a crystal ball. Use it to sharpen your decisions, not to automate them.
Frequently Asked Questions
What is the best Volume Profile indicator?
The best version depends on your strategy. For precision and consistency, Fixed Range Volume Profile is a favourite — it lets you analyse specific price moves without changing as you scroll. For day trading, Session Volume is also highly effective because it resets with each trading session.
What is the 80% rule in Volume Profile?
The 80% rule is a popular strategy based on the Value Area, where roughly 70% of volume occurs. If the price opens or moves outside the value area and then comes back inside, there’s an 80% chance it will travel across the entire value area. Traders use this as a setup for mean-reversion trades during balanced markets.
Is Volume Profile profitable?
It can be — if used properly. Volume Profile doesn’t generate buy or sell signals by itself, but it gives you high-quality context for better entries, exits, and risk management. When combined with solid strategy and discipline, it can significantly improve your edge.
Is Volume Profile a lagging indicator?
Yes, Volume Profile is based on past trading data, so it’s technically a lagging indicator. However, it shows where volume actually happened, which helps you identify zones where the market is likely to react again. It’s not predictive, but it’s extremely insightful.
What is the P pattern in Volume Profile?
A P-shaped profile often forms during short squeezes or bullish reversals. It has a narrow base and a long upper distribution, suggesting sellers were overpowered and the price broke upward. Traders often see this as a sign of aggressive buying after a consolidation or downtrend.
Wrapping Up
Volume Profile isn’t about predicting the future but about understanding the past so you can trade with better confidence and context. Whether you’re a short-term scalper or a long-term swing trader, this tool can become a key part of your edge.
It takes practice. It takes patience. But it’s worth it.
Ready to up your trading game further?
- Explore more strategy guides in our CTI Trading Academy.
- Or, if you’re ready to put your skills to the test, apply for a CTI Funded Challenge, pass it, and get funded.
No better way to learn than with real skin in the game (minus the risk).